Wednesday, June 25, 2014

Hello Friends

Hi FRIENDS,
                       I as you have seen have not posted any analysis for about a week now ,I
have got busy with a new venture ,So i think i won't be able to post analysis,Or may be 
can post once in a while,Thanks for your support and appreciation:)Hope my Analysis
helped you .

Regards
Rish

Monday, June 16, 2014

Nifty correcting towards support

Hi friends,
                   Nifty after few days sideways move went below the sideways ranfe on friday
it tested 7550 and closed below that ,Lets see the present structure of nifty.
Let me put the latest chart.
Nifty correcting towards support Looking at the chart we can see
a=c ie 7550 range has been broken 
so idealy nifty would target 7500 
level now ,ie c=1.6(a) which coincides
with gap filling also ,It would be early
to say if correction would be over
at 7500 or it would stretch we would
see how nifty reacts there.


Regards
Rish                                                                                                                                                                                                              

Saturday, June 14, 2014

Cipla breaks the range

Hi friends,
                 Cipla is one important player in pharmaceutical segment in India.
Lets look at the cipla structure it brokeout from its slanting down channel
recently.Let me put the chart.
Cipla breaks the range
From the chart we can see the full
fall structure,When i count the waves
from top i see wxyxz finished.
Which can be seen clearly from
the chart.The red count denotes
WXYXZ and yellow denotes internal
structure of each wave.
By this count we can see that an 
important low has been formed 
at 368,And i don't see that breaching


soon ,A trader should look for buying this stock in correction as long as 368 holds.
A target of 450 should be seen in this stock .Once it corrects the recent rise it should be 
a good buy.

Regards
Rish 

Thursday, June 12, 2014

Infy nearing breakout

Hi friends,
                Was looking at infy chart been following it for sometime
according to wave principle it looks poised for a nice breakout towards
all time high.Let me put the chart to show the bigger picture.
Infy nearing breakout
From the chart we can see
abc is finished and d is running
and c=1.6(a) alomost.
Interesting equation ,Lets look
at the structure of d to figure
out the internal wave structure.


Looking at the hourly chart to figure out the internal wave counts.
Infy nearing breakout
From the chart we can see 
abc structure forming in d leg
with a being an impulse and 
b being a expanding triangle
and c turning out to be a
broadening slanting ending
with e leg running .Its a ending 
pattern which usually is seen near 
tops and bottoms,Here its seen 
in c wave in correction ,So infy is a


nice stock to have in ones portfolio in each dip or for a trader its a clear buy above b ie 3340.
Keep close eye on this stock this has potential to scale 4000 + in e leg at least.

Regards
Rish

Nifty 12th june

Hi friends,
                  Nifty scaled new high 7700 and retraced fast ,Lets see the structure of the fall
Let me put the latest chart in a lower timeframe.
Nifty 12th june
From the chart we can see 
a small abc followed by a x
wave and x wave is now followed
by another abc.
The c wave targets are given by yellow dotted lines it can reverse from any
of those levels 7560-7550
remains a strong support.


Regards
Rish

Wednesday, June 11, 2014

Nifty 11th june

Hi friends,
                 Nifty inched up after completing abc correction
which was first looked like a triangle ,And is still rising ,Though intraday corrections have started 
to look steep and the buy back after that was not that fast ,First sign of exhaustion.
Nifty 11th june
From the chart we can see
7550-7560 is the first support
till thats held i don't see
a big dent in nifty.Keep that
as stoploss for your profits.


Regards
Rish

Tuesday, June 10, 2014

JUBILANT FOODS finished a big FLAT Correction

Hi friends
                 Jubilant food has made a nice pattern ,It has finished a Flat correction.
ie it did a abc correction with 3,3,5.Its a big Flat correction spread over 1 year.
Lets see the chart to see the structure.
From the chart we can see
the clear ABC structure
and even can see 3 waves
of A , 3 waves of B and
5 waves of C clearly.
A clear cut Flat correction
A powerful pattern ,This is a good trading stock for next few months
with a target of 1900-2000.
Buy this stock in dips and add


on to it.You would see 1900 in it in coming time.

Regards
Rish 

Monday, June 09, 2014

Hathway cables and Unitech wave targets

Hi friends,
                 I had posted about hathway and unitech sometime back and had anticipated 
big run ups in them.
Look at what i said about HATHWAY CABLES.
This stock did a big abcde consolidation spread over more than a year
but see the beauty of pattern once it was finished it took not even 2 months
to breach resistances and scale an all time high.
A handsome 40%+ move in about
a months time indeed priceless.


Lets look at UNITECH and see what i said about it.
It was at 14 and i was able to see a rally rowards 26 at that time now it has reached 37.
A handsome 100% return in
about a months time.So its all
about what technical analysis
tool one uses to reach his/her
tradesetup.I have been using 
elliottwave for last 7 years 
and i have been rewarded well.
gives a trader edge over others.


Regards
Rish 

Saturday, June 07, 2014

Sugar sector Update

Hi friends,
                I had mentioned about the coming breakout in Sugar sector .Since then we have seen
big gains in that sector As i had said this sector moves in sync all sugar stocks ran,
We have seen gains  from 80% to 20% in them in a very short span of time.
The big guns Namely Bajaj hindustan and renuka are on brutal run hope you saw the last
post and got benefited from timely post!!.

Look to book small part profit on monday in sugars and hold rest for bigger targets.
Below giving an example to demonstrate how a good breakout can be caught if
wave principle was applied.
Lets see the bajaj hind chart.

From the chart we can see 
how the stock broke from 
a small ABC  correction
and it was caught well
by the slanting trend line
and after that the big move
was seen which was caught
properly.So a simple abc 
gave humongous move


after breaking out ,Thats why i say knowing Wave principle Akka Elliottwave trading gives
an edge over other traders to spot the setups much ahead of others of course if applied 
correctly.

Regards
Rish

Friday, June 06, 2014

Nify Squeeze

Hi friends,
                 Nifty continued to squeeze ,It broke from the contacting squeeze yesterday
and is trending up,Above 7504 it would be confirmed triangle has been broken out.
Lets see the full picture.
Nify Squeeze
From the chart it can be seen
the red lines of triangle
has been taken out and has 
closed above that.Now as 
long as it holds above that nifty 
first target comes at 7503 and above
that nifty can target alltime high above
previous high which it made on election
result day.


The green dotted slanting trendline is the support line till that is not voilated nifty uptrend
would continue.

Regards
Rish 

Thursday, June 05, 2014

IndiaVIX reaching support

Hi friends,
                     In my last post on VIX i had written about VIX BREAKOUT .We saw handsome 
breakout and witnessed a rally from 14 to 38 levels in a short span of time.
Lets see the present picture .
IndiaVIX reaching support
After spending time near highs
Vix reversed and has reached support
From wave priciple we can see vix is
almost finishing 5 wave down
A case for a rise coming up in some
time ,Look for VIX to head north 
in sometime ,We can see vix back to 22 levels soon play accordingly.


Regards
Rish 

Tuesday, June 03, 2014

HDFC ABC galore

Hi friends,
                 I had posted about HDFC ABC'S how the waves evolve ,We witnessed continuous
abc formations ,Till now we have seen 3 consecutive abc's .
Lets see the chart.
HDFC ABC galore
In my last post i had told
about the reversal coming
near 870-865 levels,The
stock went till 862 and reversed
from there and presently trading
at 911,A handsome 5% rise
You can see we just counted 
waves and tried to figure out
next structure ,The last post 
the stock was at 895 and the 


expected fall was till 870-865 the stock fell till 862 and reversed ,Idea was if some one knows
Elliottwave Trading it makes much easier for a trader to anticipate reversals.

Regards
Rish

Monday, June 02, 2014

Banknifty trades in Triangle ahead of RBI Policy

Hi friends,
                  Banknifty is trading in a classic textbook triangle
with clear 2 waves in each leg look at the chart below .
Banknifty trades in Triangle ahead of RBI Policy
According to chart if 14700
holds we are heading higher
in d leg of triangle .
Overall a nice triangle squeeze underway.


Regards
Rish 

Sunday, June 01, 2014

NTPC the electric giant followup

Hi friends,
                 In my last post NTPC the electric giant i had mentioned about the wave reversal 
what we can see in NTPC and yes it indeed reversed ferociously .
Let me put the latest chart to show the current picture.
NTPC the electric giant followup
The last post when i had put the
stock was hovering near 120 levels
and it shot up to 167 level quite fast
and now retracing the rise.I see a very
promising future for this stock.
The power crisis is a very old problem
what India is facing and with out NTPC we cannot solve that problem
and now with Modi at the helm of 
government ,Things look rosy for this 
stock because ,For once we can 

expect faster disposal of government files etc.The latest being the Uttar pradesh power crisis people are 
facing 12-14 hrs power cuts ,NTPC is well placed to solve such crisis ,Now even has got own railway 
lines and bogies to get supplied with uninterrupted supply of coal to full fill its power factories demand.
Next few years are NTPC years:)

Regards
Rish 

Thursday, May 29, 2014

HDFC ABC Continues

Hi friends,
                 Let me show tonight how a stock pattern is formed slowly ,The only reason 
a trader misses a pattern is the time consuming nature of pattern formation.
HDFC ABC Continues
This HDFC chart we can 
see how continuous abc 
formation is seen this is
third abc (zigzag ) in it
still early in the pattern but
if a=c then a fall till 870-865
can be seen after which the stock
should reverse ,Track this stock
its one of the super heavy weight


in nifty ,Lets see how this moves in coming sessions .

Regards
Rish 

Wednesday, May 28, 2014

Nifty wave counts 28th may

Hi friends,
                Nifty continue to move above 7200 keeping both counts alive :).
with expiry approaching fast a decisive move is on for sure .
Lets see the chart structure.
Nifty wave counts 28th may
A squeeze kinf od structure is forming
near 7300 levels ,Lets see if nifty continues to be in the same range or
tries to break that range.Once the range breaks i would post the further
structure because as of now 2 counts 
are active once it confirms 1 count i would go further with the same count
and post its further move so keep eye on 7200 as long as that holds Nifty looks fine ,

Below 7200 we get new lower levels.
Regards
Rish 

Tuesday, May 27, 2014

Nifty wave counts 27th may

Hi friends,
                  In my last post Nifty i mentioned about B up and a rise coming towards 7350+
Looks like the c wave stretched and we hit 7500+ and fell brutally in a fast move.
Lets look at the chart.
This count says we 
finished B at 7500+ and
have started C down for 
a target of 7070.
This count is bearish and nifty 
can target 7070 if a=c and can
stretch if it goes below that.


Another count i have in mind if we hold 7200 which would be bullish abcde count
as shown in picture below.
This count suggests of we hold
7200 we can have this move 
coming up.Lets see how
nifty moves today
this being expiry week 
move can be volatile 
keep an eye on levels
to see what move 
emerges.


Regards
Rish 

Saturday, May 24, 2014

Indiabull real estate breaks out

Hi friends,
                 Indiabull realestate comes out of down channel its showing exciting trend ahead lets
see the long term picture. The stock has corrected 850 levels to a low of 40 in 4 years.
Indiabull real estate breaks out

 From the top the structure
looks to have made 
abcde and it has broken
out from that channel and
suggests a new upmove after 
finishing abcde ,This stock 
is buy in dips ,It can retrace back to 
test breakout support or near
that buy in steps ,Target would 


be about 200 rs in a year time max ,Keep this stock on radar .

Regards
Rish

Stocks go in 3rd wave spin (Modi effect!!)

Hi friends,
                  We are witnessing one of the best time since 2008 midcap rallies,Stocks  just 
took off and are not looking back.I had given many stocks here on blog they did exceptionally
good Dredge corp has doubled in matter of 45 days ,Let me put the chart.
From the chart we can see how 
brutal move this has been 250
to high of 570,This is characteristic
of 3rd wave sift and fast move 
and it continues in overbought move
Agolden rule here Big moves usually 
come in overbought (Up) and oversold
(down).So now important point here 
is the stock has almost reached 1.6 of
wave 1 which comes at 600 levels
One need to be carefull near these 

levels profit booking can emerge and a 4th wave consolidation may happen before further move up.
This is still an anticipation according to wave analysis so don't book out before confirmation 512 would
be a good trail .

The next big stock which was caught at right time was Reliance capital 
This stock also ran fast enough 340 TO 550+  let me put a bigger chart for relcapital
to see what is the bigger picture.
We can see from the chart the
stock has finished a potential
ABCDE and has broken out 
of slanting trendline which 
suggesting big targets in coming
time as long as the breakout holds
this stock would continue to be buy 
in dips with a much larger target 
in the range of 800-1000 rs
This stock looks set to gain its past


glory in coming time :).

Thursday, May 22, 2014

DLF big Bottom made?

Hi friends,
                   DLF was in news for wrong reasons recently or rather should say
because of close ties with Robert Vadra ,As the election showed a tilt towards Modi
This stock started to fall as Modi did say lot about the Vadra land deals.
Lets see the chart to see the clear picture.
DLF big Bottom made?
The stock went down from 170
to 140 levels ,And slowly started
to rise back and eventually rose
furiously and had today touched
212.Lets see the bigger picture
of the stock ,The yellow count 
abc the count is very clear .
The yellow trend line has to
be broken upward to consider
big breakout towards upside.


Lets see how DLF behaves near tend line resistance 240-260 ,

Regards
Rish 

Nifty wave counts 22nd may

Hi friends,
                 Nifty continues its move in a small range ,In my last nifty post
had shown the given options available.
Nifty did breach 7350 on 20th though it was opening spike,Lets see the 
present picture.
Nifty wave counts 22nd may
From the chart we can see 
since 7350 was breached in initial
trades on 20th ,The impulse down
thing looks unlikely,Once nifty
sustains above slanting trend line
we can see c wave rally of c wave
of bigger B wave ,Below 7206
the c wave rally may not come 
today would be a decider,As 
we have been sideways for


sometime after election spike.
Lets see how nifty moves in next few days.
Regards
Rish 

Tuesday, May 20, 2014

Sugar sector trying breakout

Hi friends,
                  Sugar sector is one sector,Which is independent of market move 
and moves on its own and usually full sector moves together,I went through most
of sugar stocks and i feel most of them are ready for breakout.
Let me put few charts which would clear the picture.


From the above charts we can see most stocks have brokeout and few are attempting 
breakout keep an eye on this sector nice move is expected in this sector.

Regards
Rish 

Nifty settling after election jump

Hi friends,
                As usual election day saw wild swing ,Trader on the right side
would have made good money ,Wrong side would have got wiped as the volatility
was huge,Well now vix has melted so volatility should get normal now.
Lets see the wave structure of the fall from 7563.
Nifty settling after election jump
From the chart we can see
a nice trending move in 123
now till 7350 is held we can
take this fall as a impulse 
which suggests below 7170
we should head towards 7000
even if this is abc (W)at the low
we made on election day and 
this is a new wave up till 7350
is not crossed we can confidently 


say a fall towards7000 should come.Lets see how nifty behaves over next few days

Regards
Rish 

Thursday, May 15, 2014

Nifty Election squeeze

Hi friends,
                   Well the event has arived lot of hype build in Expectations are high
BJP led NDA is expected to get majority according to exit polls .
We saw expectation rally already from 6650 to 7200.Lets see the present 
chart structure.
Nifty Election squeeze
Now tomorrow election results
Nifty moves depend on what kind
of numbers NDA gets this expectation
is build on clear majority to them,Any
surprize or shock can spin the market 
big ,From the chart we can see a nice
squeeze building up for last 2 days 
which suggests market waiting for
a trigger ie election result ,Technically
the move below 7070 would invite


gap filling and nifty can drift down to atleast 7015-7000.We have usually seen market running bothways
as the counting starts like during budget day ,So be safe and trade lite you can always trade heavy on 
any other day enjoy the move and jump in only when you understand the move .

Regards
Rish 

Wednesday, May 14, 2014

Why learn Technical Analysis(UNITED BANK)

Hi friends,
                  Came across a nice pattern chart ,United bank i keep writing few posts which
are dedicated to inspiring traders,Investors to learn technical analysis and wave analysis.
Let me put the chart to see the pattern.
Why learn Technical Analysis(UNITED BANK)
This is weekly chart ,From the 
chart we can see a big ABC 
correction unfolded in last
3 years ,Interesting relation 
between waves can be seen
A=C(almost)thats an interesting  
observation,And the stock 
has reversed towards upside
,Now this stock is a buy in dips
it would target first 46 above 


that 55 and once trend line resistance is taken it can double quite fast towards 100,Buy this
stock and hold for next 6 months at least to get good reward.

Regards
Rish

Delta corp heading towards new high

Hi friends,
                 Came across a nice trading pattern in DELTA CORP lets see the chart.
Delta corp heading towards new high
We can see from the chart 
delta corp came out from 
a multi year coreection in
2013 end .We are looking
at an impulsive move from 
the lows of 39 ,The 3rd wave
was a lil bigger than 1.6(1)
we can see a jump to 140 
levels on this script thats 
a nice 20%+ move


This stock should be accumulated in dips a nice move is expected soon.

Regards
Rish 

Tuesday, May 13, 2014

How to trade Nifty after exit polls

Hi friends,
                 In my old post i mentioned about nifty resting or consolidating
after steep run,My expectation for a bottom was around 6600 levels nifty 
reversed from little above that.
Lets see the present picture.
How to trade Nifty after exit polls
From the picture ,It can be seen
i have marked 2 counts yellow
and green .
The green one is quite bullish count
which suggests extension and we 
are in 3rd of 3,This count portrays
a very bullish picture in coming months.
The Yellow count is abcde and right now e is on,Some observations from 
this count c=1.61a(almost) and right 


now even e is exactly equal to a ,Interesting indeed ,The point is nifty is right now hovering in an important
area 50-100 points here and there is ok but if we don't cross this range of (7000-7200) we should be in for
a consolidation which can turn into a good steep profit booking below 6700.In a bull case 6700 would be held that,s where the big support lies for the recent rally.
Track these levels closely and we see where nifty heads post 16th!!.

Regards
Rish 

Sunday, May 11, 2014

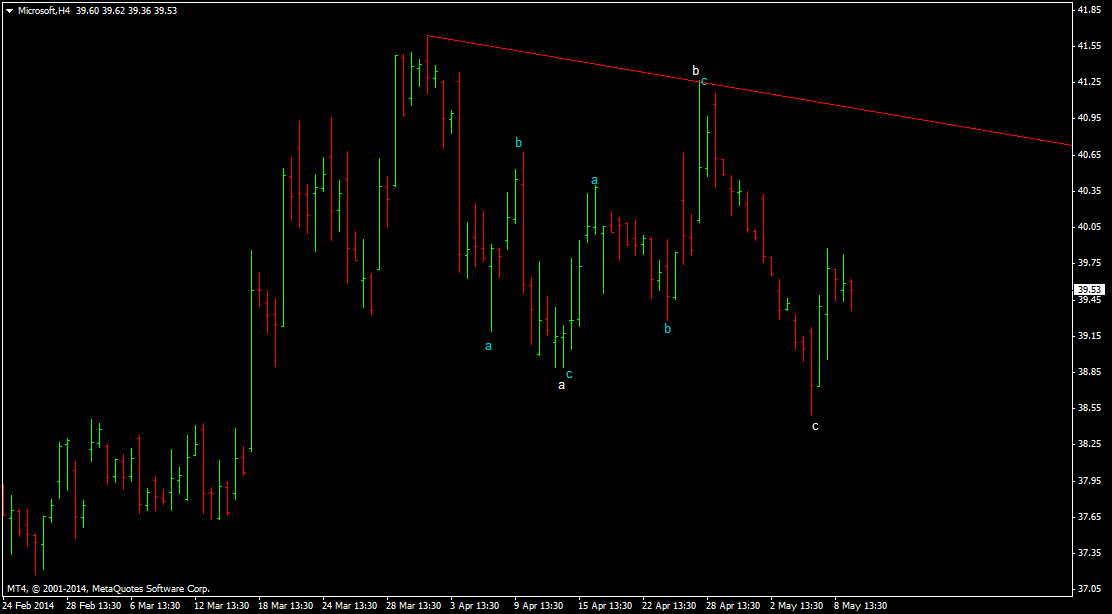
Microsoft trade setup

Hi friends,
                  I see that an abc correction has ended in Microsofr
and its right now trending up ,This should target atleast 41$
above which it can breakout towards 45$
Let me put the chart to get a clear picture.
Microsoft trade setup
From the chart we can see white 
abc is finished and a new upmove
has started and it should target 41
atleast above which 45 is possible
Ideal trade would be to buy in dips
with a stoploss of 38 for a target
of 41 and then above that 45.
Previously we saw a nice spurt
in Apple which i had posted
earlier.


Lets see how microsoft moves in coming days.

Regards
Rish 

Saturday, May 10, 2014

GAIL Trade setup

Hi friends,
                  I had posted Gail some time back and the stock moved a bit and then 
started to consolidate in a range .
Let me put the chart to get a clear view .
GAIL Trade setup
From the chart we can see that
the d wave is taking time and 
right now we could be in bwave
(blue) precisely c of b should 
happen so here we have a small
long trade as long as gail holds 
on to the low of 356 it can 
target 391.
So ideal trade would be buy 
in dips with a sl of 356 


for a target of 391. Lets see how this stock moves.

Regards
Rish 

Why Learn Technical Analysis

Hi friends,
                  I have been writing this blog for many years now .Due to my writings on blog
i got many opportunities to interact with investors and traders.
I have come across traders who trade on gut feel ,Tape reading ,Technicals and few tukka(fluke) traders too,Still a large chunk of traders depend on news and tips from other sources ,By other sources i mean
tips given on social media ,on tv and even on sms ,These tips can't be trusted fully till one follows them 
and analyses their success ratio.
I always advocated about learning technical analysis ,As it gives trader confidence and logical reason
to go for the given trade,Even if you don't wanna get deep in technical analysis ,You should at least
go through the basic technical course .
A course which equips you with knowledge of how to see chart ,How to spot support and resistances
Trend lines etc,You would be sure after this course that you can analyse a given trade whether to go for
it or avoid it.
Why Learn Technical Analysis

Their is no short cut to success.
Stock market is a serious business
many take it as gambling as they 
don't have the knowledge for it.
You need to have an edge above 
others to win in this hence 
technical analysis comes in to 
picture.I have in past helped
many traders and investors
to learn Technical analysis


Of course I take fees for it ,Free lunches don't serve the purpose,For seasoned traders i take Advanced
Elliottwave course which hones them with skills which help them to spot an opportunity before it occurs
and catch it and sit tight on it till favorable move happens .If you are interested to know more about
these courses do mail me at rishrich at gmail dot com do mention  subject as technical analysis.

Regards
Rish 


Thursday, May 08, 2014

Banknifty wave structure

Hi friends,
                 Banknifty has been moving in range for quite sometime.
Let me put the daily chart to show the sideways move.
Banknifty wave structure
Now lets see the sideways move closely its been spending time in the range as we reach
towards end of elections and near exit poll and eventually results on 16th.
Let me put the lower time frame chart to see sideways move closely.
Banknifty wave structure
From the chart we can see
abcde move is over
and abc move is on 
now if banknifty trades
below 12977 it would
fall towards 12700
falling in c wave if it doesnot
fall below 12977 and goes 
above 13100 ,I would have
to reconsider this count.


Lets see how banknifty moves tomorrow.
Regards
Rish 

Wednesday, May 07, 2014

Nifty starts c wave

Hi friends,
                   I had posted about nifty structure yesterday .
Nidty did a time consuming sideways uppish b wave and today
started c wave down lets see the chart.
Nifty starts c wave
By going below a low
its confirmed that c down
has started and logical
target comes near 6600-6580.
I expect slow drop the way
it has happened over last
5 days.Lets see how nifty does
this c wave .


Overall nothing big has happened yet nifty after rally is consolidating looking
for clues from elections.
Regards
Rish

Tuesday, May 06, 2014

Nifty wave structure

Hi friends,
                   Nifty continues to slide down slowly ,Few stocks continued there correction
and few maintained their rise result nifty showed very little move and almost remained
Nifty wave structuresideways,I expect the
yellow line move in coming days
either nifty can remain sideways
or should move in yellow line
structure.Overall the time consuming sideways structure suggests everyone is confused
about election or are scared to
take positions today even volumes were low ,We are in for exciting move in some time.

Be attentive and track IT stocks closely.

Regards
Rish

Thursday, May 01, 2014

Tata motors Trade setup

Hi friends,
                   Tata motors have been inching up ever since the 2008 lows
and been inching up ,I see a trade opportunity in it with low risk
Lets see the chart.
Tata motors Trade setup
From the chart we can see
an abc is ending,So we
should have a upmove coming
soon ,Ideal trade would be
to long the stock in dips
as long as 400 holds and the
stock can target 440-450
,This could well be taking
the shape of a wedge well
thats still an anticipation.


Lets see how stock performs in coming days.
Regards
Rish

Tuesday, April 29, 2014

IDBI Trade setop

Hi friends,
                   A small short trade setup can emerge ,Below 67-66.50.
Let me put the chart to get the picture clear.
IDBI Trade setop
From the chart we can see
IDBI is in 5th of a hourly
impulse where 5th has
grown bigger in size price
wise and even timewise .
Now here 5th is making
a ending diagonal and its
almost complete and below
66.50 this stock can fall to
atleast 63 .


Trader can maintain a stoploss of 68 and plan this trade.
Lets see how stock performs in following days.
Regards
Rish

Nifty wave structure 29th april

Hi friends ,
                   Nifty continued with its slow drop.
I expect a bounce back today from lows  preferably 6750-6730
Waves suggest a wave is coming to end ,Let me put the chart.
Nifty wave structure 29th april
Lets see how nifty reacts
to supports ,Overall i am of
the view ,Nifty is trying
abc correction and it should
finish a today so we should
see bounce back today .
Above 6820 ,I would be thinking
about alternate scenario.


Regards
Rish

Sunday, April 27, 2014

Nifty Tests resistance

Hi friends,
                  Had posted in my last on nifty about resistance zone 6850-80
Nifty made a high at 6861 and reversed.
Lets see the nifty chart.
Nifty Tests resistance
We can see from the chart
a expanding triangle like
shape had formed and it reversed from trendline resistance.
According to wave theory
a break below 6700 would
confirm c is finished and d
wave has started.
Track closely nifty if 6700
gives up c we can target 6600-


6580 ie d wave .This is short term top only according to me,Dips would be good to buy
stocks and quality midcap for sudden spurts.
Lets see how nifty performs in coming sessions.

Regards
Rish

Why learn Elliottwave (IDFC)

Hi friends,
                   Continuing with  my topic why learn Elliottwave ,Today i would show
example of IDFC,The stock which i tracked extensively,And was able to forecast its
move first loosely and later on with perfection.
IDFC TECHNICAL CHART This was dated 22nd jan,In which i forecast ed a small
rise followed by a fall towards 95 and then a rise towards 120+.
What happened in real small rise didnot come ,A sideways move happened few days
then a fall happened towards sub 90 levels and then a steep rally happened towards
128+(The actual high is 139 but that was a spike and was retraced fully intraday).

Then i posted this again few days before Banking license announcement
IDFC BANKING LICENSE HYPE ,In  this chart i forecasted a move towards 106+
buy was around 93.50 with stoploss at 92.80 and target was 106+ ,The stock went
much above that this was an ideal safe trade which i was able to generate because
i was able to see the bigger picture of this stock ,So i broke the stock into small parts and
saw lower time frame charts to figure out ideal trade.

Now again lets see the bigger picture
Why learn Elliottwave (IDFC)
From weekly chart i see that
the stock did a WXY from
november 2010 top till
end august 2013 .A new upmove started from there ,This can be
a X wave or a new impulse of
a bigger degree which we can see
later on as the wave reaches
advance stages.


Let me put the structure of the rally from august 2013 lows.
Why learn Elliottwave (IDFC)
We can see that stock did a abcde
from low of 76,Then stock corrected
and retraced towards 88 from a
high of 117.8 ,And again rose
in 5 wave up and started its correction,Now if this is an X wave it should not cross the slanting
channel trendline i made in
weekly chart ,Look at the
structure of fall from 139 closely


We would have a trade coming up here soon,Track this stock closely.

Regards
Rish

Saturday, April 26, 2014

NASDAQ wave Analysis

Hi friends,
                   Nasdaq finished a triple zigzag correction
ie wxyxz ,Let me put the chart to see the triple zigzag .
NASDAQ wave Analysis
The TOP made in early march
,The fall from there till mid april
took the shape of triple zigzag
which can be seen from the chart
how perfectly triple zigzag
correction took place.
The index is still moving below
trend line resistance ,We did
a or 1 wave from triple zigzag
low ,As long as this low holds
we are moving higher.

Lets see next few days move in Nasdaq i am confident of a long trade emerging here.

Regards
Rish

Friday, April 25, 2014

ICICI BANK wave structure

Hi friends,
                    Icici bank came up with results today
ICICI Bank's net profit rose 17.84% to Rs 9810.48 crore on 12.77% increase in total income to Rs 54606.02 crore in the year ended March 2014 (FY2014) over the year ended March 2013 (FY2013).
Net interest income increased 19% to Rs 16475 crore in FY2014 from Rs 13866 crore in FY2013. Net interest margin increased by 22 basis points from 3.11% in FY2013 to 3.33% in FY2014. Non-interest income increased by 25% to Rs 10428 crore in FY2014 from Rs 8346 crore in FY2013.
I had posted a chart a day back about the fall coming in ICICI BANK .
We have seen profit booking after the result .
Lets see the bigger picture in ICICI bank wave structure.
ICICI BANK wave structure
From the chart we can see that
er are in process of finishing
a 5 up .So in the bigger picture
we have 2 impulses joined by
abc .The 5th of this impulse
is abcde ,Let me expand the 5th
to get a better view ,What i mean
by this.Overall a fall towards 1220
1200 is on cards to finish d wave
of abcde.


Let me put hourly chart to get a better view of abcde
ICICI BANK wave structure
 We see 3 abc's joined together
now with d on i expect this
fall to target 1220-1200 before
e leg up unfolds.
This structure holds good as
long as c top is not breached
Overall the stock is resting after
steep run up and requires to
correct once it completes
this pattern


Lets see how the stock unfolds in coming weeks.

Thursday, April 24, 2014

Apple computers Trade setup

Hi friends,
                   I some times post about US stocks last time i had posted about
Mcdonalds.My expectation was it shiould rally towards 100$ ,Yes the stock
rallied towards 100$.
Now i am posting Apple trade setup,Let me put the chart.
Apple computers Trade setup
Its a classic zigzag correction
The stock has done ab leg and
right now ready to do c leg
,Trade idea would be to buy
this stock now and even in dips
as long as 510$ holds ,This
stock can target 550$.
Buy and wait patiently for
the target to be reached.


Lets see how the stock moves

Regards
Rish