Friday, January 31, 2014

Ultratech Technical chart

Hi friends,
                    Ultratech is looking to come out of a squeeze which is happening for some time
lets look at the Ultratech Technical chart,
Ultratech Technical chart
Looking at the chart we can easily see it finished a wxy at 1634.From there we had a nice A or 1 up
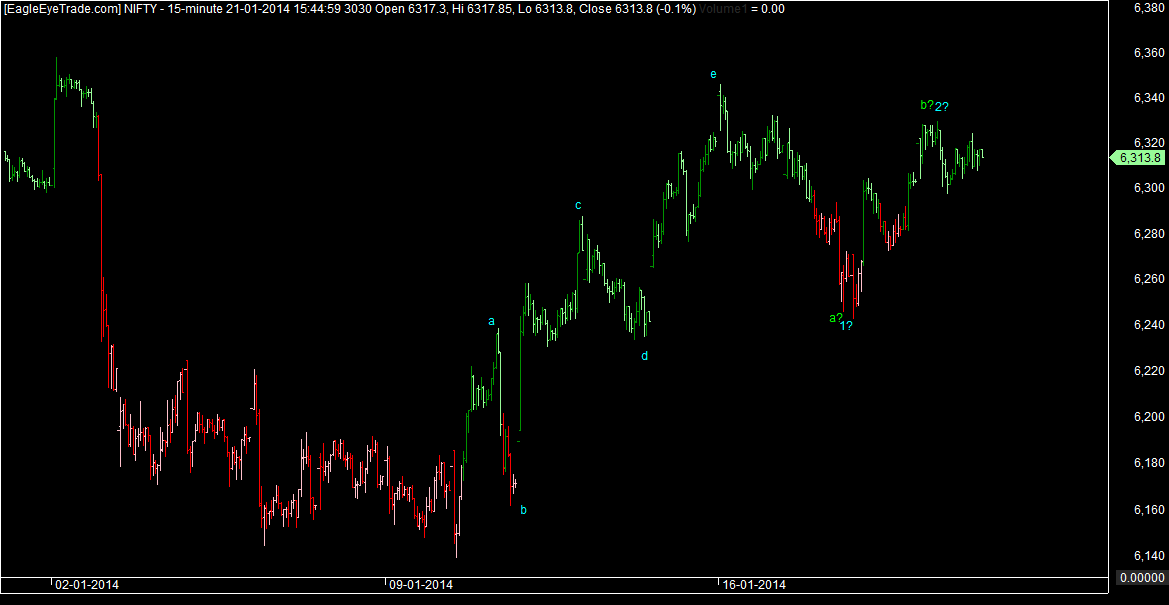
and then a correction started for the rise,In correction i see every leg has got 3 waves so
a kind of squeeze or triangle underway.
Lets look at the squeeze closely.
Ultratech Technical chart
So this stock has potential to go towards 1780 provided 1660 holds.
So here we have a nice swing trade setop buy in range 1680-85
stoploss neat 1660 and target 1780 .
Need to be carefull neat 1710-1720 reason once thats crossed 1780 would be
coming soon.

Regards
Rish

Adani Technical chart

Hi friends,
                    Lets look at Adani Technical chart ,The stock rallied from last year september
till mid of december 2013,And after that its in downward move slow drop in parallel channel.
Lets see its daily chart.
Adani Technical chart
So we can see the correction is maintaining a parallel downward slopping channel.
Lets look at the correction closely ,On hourly chart.
Adani Technical chart
From hourly chart we see that we have finished abc correction and again started another
abc correction ie 2 abc corrections joined by a x wave so eventually a wxy correction is on
right now we are in y leg which should minimum do 225 which is downward channels
lower trendline.Once wxy gets complete we should have a good long trade on our hands.

Regards
Rish

Thursday, January 30, 2014

Nifty Expiry day Intra movement

Nifty after gap down is moving in a range till now and its making
a squeeze .
In my old post had told a=c would be 6070 and we are trading below that right now 
so a wave stretch can happen,Else it has to pull back above 6070 soon.
Look for old post on nifty here Nifty technical chart .
Nifty expiry day intra movement
Bulls can have a positive expiry only above 6070 ,Bears on the other hand if we remain below 6070
can stretch towards 6000-5980.

Regards
Rish

Free E Books ,Trading,Day trading,Investments

 Four biggest mistakes in trading futures
First the bad news: best estimates suggest that 90% of
individuals who trade commodity futures lose money doing
so. Now for the worse news: This estimate may be too low.
The sad fact is that somewhere along the way the majority
of traders make one or more critical mistakes in their
trading,
 Read the full e book
Four biggest mistakes in trading futures 

The little book that beats the market 

This book was originally inspired by my desire to give each
of my five children a gift. I figured if I could teach them
how to make money for themselves, then I would be giving
them a great gift—truly one that would keep giving.
Read the full e book 
 The little book that beats the market

FRL Technical chart

Looking at the FRL Technical chart ,We see a nice spurt from 60 odd level
to all the way up to 90+.
We had correction after that which lasted almost a month it was a range bound
correction,In elliottwave terms FRL did a expanded flat correction.

FRL Technical chart
Now from 79 onwards we have a nice spurt in price which confirms the end of correction.
We have a nice swing trade setup in this script.
This stock is a buy now and in dips with stoploss below 79 for a target of 100+.

Regards
Rish

Wednesday, January 29, 2014

Nifty Technical Chart 29th january

Hi friends,
                     Nifty breached 6130 ,Though only intraday but it looks like we would
hit lower levels after some pullback ,I would consider this count henceforth .
Nifty technical chart
Minimum target for c wave would be a=c ie 6070.
If it stretches we have other levels ,To read old nifty post go to the following link
Nifty technical chart.

Regards
Rish

Tuesday, January 28, 2014

IRB Technical chart

Hi friends,
                    IRB Infra ,I had posted coulple of months back stating above 100 this stock pattern
changes and it would do great ,But this stock did not cross 100 so this started a new
corrective wave now,Read old post here IRB INFRA .
Lets look at the present picture.
So we made a X wave with a double zigzag and now the stock has started its Z wave.
So eventually this is tripple zigzag or WXYXZ correction ,This stock can make a new low now,
50 is very much a reality now ,For investors its a no hold stock till we come near its lows of 60-50 .

Regards
Rish 

Monday, January 27, 2014

Bank nifty Technical chart

Hi friends,
                   Had posted banknifty last week and expectation was if 11200 is not crossed
we are in for further weakness.
Read old post here Bank nifty .
Lets look at the present picture of banknifty .
I figure out from chart the fall is making abcde and right now we are in e wave.
And we are nearing 50% retracement of total rise from september 2013 8600.
Tom morrow being RBI policy and e wave down happening,Chances are high
that we make a short term bottom in banking .
If we make a bottom tomorrow that would end the first leg of correction or Aleg.
Waiting to see what Rajan does tomorrow fingers crossed.

Regards
Rish 

Sunday, January 26, 2014

Nifty Technical chart Structure

Hi friends,
                   At last a 1% + fall we saw in nifty ,Lets see the present scenario in nifty.
For the last post on nifty refer this link Nifty technical chart .

In last post had mentioned in any case a fall was coming ,First scenario was 6130
and the second one a deeper correction.
Now near 6130 we would see the structure to fingure out the further move.

Regards
Rish

Thursday, January 23, 2014

Gold Technical chart

Hi friends,
                    Looking at Gold chart this commodity has corrected for more than a year now
its biggest in last 12 years timewise.
Looking at the chart technically,It seems gold could be making a triangle or a flat.
As we have seen 2 consecutive abc's ,A good setup for a long at present juncture
and in dips.
Gold would move in two slanting red trendlines for quite some time and should hit
1390 positionally,1180 is the support below which the present pattern fizzles.
So ideal buy would be buy as near possible to 1180 ,To minimize the risk.

Regards
Rish

Wednesday, January 22, 2014

IDFC Technical chart

Hi friends,
                  I am looking at IDFC chart today,Lets see the chart closely,The rally from
end august 2013 makes abcde and ends by mid dec 2013.
Look at the structure after finishing abcde we see a squeeze in making with each leg 3 waves.
we have done abc and right now d is on ,I expect a rally towards 105 and then a fall towards
95  ,These levels are tentative they can change lil bit but direction would be as i expect.
With RBI policy coming these banking stocks would be ready for action .This structure complition
should breakout to give upside target to about 115,120 ,Would look the chart near RBI policy
track this stock closely and see if the above chart move happens or not.

Regards
Rish

Nifty Technical chart Presentation

Hi friends,
                   Nifty continues to hover in the same range not much happened from previous post
we had a small drop and now almost retesting that top.
The above chart pretty much says what i told you its hugging the upper resistance trendline
coming to a lower time frame we see following wave structure which suggests this
sideways movement can end any time now.
Broadly if the previous high ie e is not taken out any of the count can fit in blue one
would be nasty wheras green one would be a small correction max 6130 kind but if blue one
happens we are in for a deeper correction.This would get invalidate if we cross 6350.

Regards
Rish

Monday, January 20, 2014

Banknifty Technical chart

Hi friends,
                   Looking at Banknifty chart ,I rarely trade on banknifty its supposed to be
quite volatile,I try options at times when i get confident.
Anyhow coming to the chart ,I see following on chart.

We can see from chart that we have finished abcde on 9th dec 2013 and are in correction
after that a slow correction,Now this index would show strength above 11200 below that it would continue its slow downward correction we Have retraced total rise of abcde 38.2% .
Looking at stocks within Banknifty PSU banks and Private banks have diffrent structures.
Banknifty is on watch for next few days to see if it shows strength and goes above 11200 or not.

Regards
Rish

Saturday, January 18, 2014

Coalindia Technical Analysis

Hi friends,
                   Today i have coal india chart ,I would analyze this stock according to wave analysis.
Have a look at the following chart which is of daily time frame.
From july end 2011 high this stock started complex correction ,Red labeling wxy.
We have seen complex correction takes time this stock from a high of 400+ went all
the way to 240 in 2 years time frame where a big WXY ended.
Lets look at the structure closely from 240 onwards look at the following chart.
 We have already seen abc twice which suggests a triangle underway or a flat correction.
We have to see the structure of this currect move from 307+ to figure out whether a triangle
is on,If its a triangle the fall should not exceed below 260 and should reverse up.Keep this stock on
radar nice trending move would be underway once triangle or flat correction gets over.
One more important reason to track this stock this stock mostly remains unaffected by nifty move.

Regards
Rish

Friday, January 17, 2014

Nifty technical chart 17th january

Hi friends,
                   Nifty is very much in triangular move,In last post i had mentioned about d up
we can see nifty has almost reached there.Refer to last post Nifty technical chart .

Now in current scenario till nifty doesn't cross 5360 ,It would be assumed its in d up
Why i had to think about this because sensex did break 2 nd jan high ,Though it
came back a bit after crossing it.
  Today or max by friday we should know whether e leg fall of triangle happens or
nifty tries diffrent things :).

Regards
Rish 

Wednesday, January 15, 2014

LIX15 Technical chart

Hi friends,
                     Nifty introduced this LIX 15 index last year in july ,It contains stocks of different sectors,Looking at the structure of LIX index .
We have to see that this index holds 2500 then this count gets valid.Chart looks good countwise
we almost finishing a abc from december high,Keep close watch on this index this index
contains following stocks.


Axis Bank
Bank of Baroda
Cairn India
Hindalco Industries
IDFC
Jindal Steel
JaiprakashAssociates
JSW Steel
Maruti Suzuki India
United Spirits
RelianceCommunications
State Bank of India
Tata Motor
Tata Steel
Yes Bank

Regards
Rish