Hi friends,
Nifty continues to hover in the same range not much happened from previous post
we had a small drop and now almost retesting that top.
 The above chart pretty much says what i told you its hugging the upper resistance trendline
coming to a lower time frame we see following wave structure which suggests this
sideways movement can end any time now.
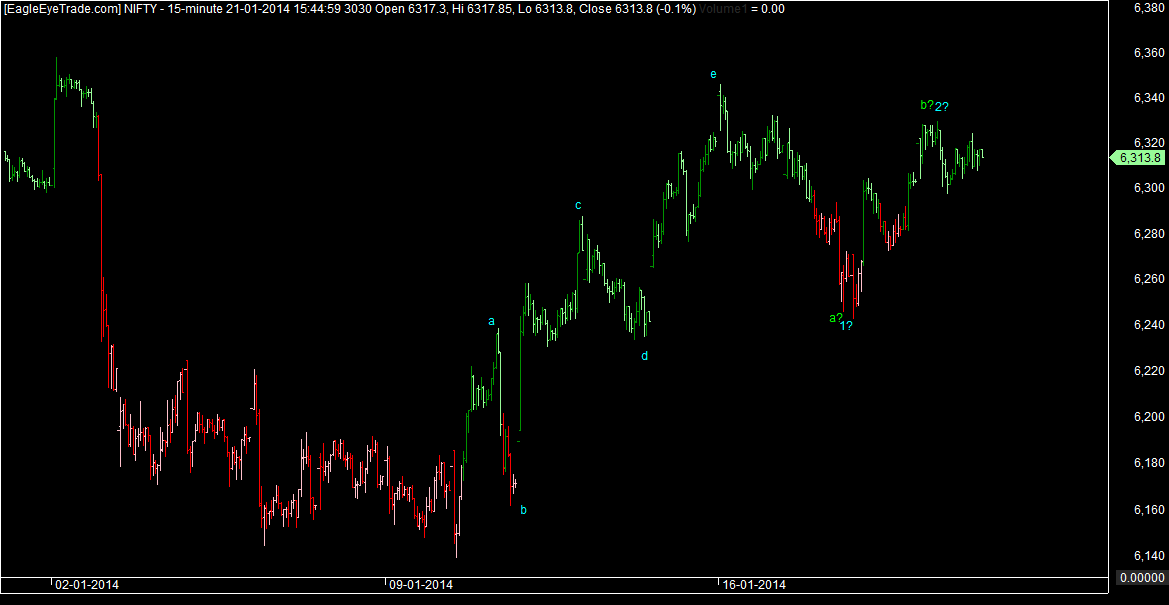 Broadly if the previous high ie e is not taken out any of the count can fit in blue one
would be nasty wheras green one would be a small correction max 6130 kind but if blue one
happens we are in for a deeper correction.This would get invalidate if we cross 6350.
Regards
Rish
Nifty continues to hover in the same range not much happened from previous post
we had a small drop and now almost retesting that top.
coming to a lower time frame we see following wave structure which suggests this
sideways movement can end any time now.
would be nasty wheras green one would be a small correction max 6130 kind but if blue one
happens we are in for a deeper correction.This would get invalidate if we cross 6350.
Regards
Rish
No comments:
Post a Comment