Thursday, October 15, 2020

How Nifty performed under different prime ministers of India

Hi friends,

                  Lets see how nifty has performed under different prime ministers of India.
The data is taken from PV NARSHIMHA RAO's tenure onwards.


I took data from PV NARSHIMHA RAO onwards as,He is often referred to as the "Father of Indian Economic Reforms". Future prime ministers Atal Bihari Vajpayee and Manmohan Singh continued the economic reform policies pioneered by Rao's government. He employed Dr. Manmohan Singh as his Finance Minister to embark on historic economic transition !!.
In the above table the data for narendra modi is taken till 14th oct ,His tenure is still not finished.

Lets see the nifty move in chart in different prime ministers tenure


Wednesday, September 23, 2020

Nifty wave analysis

Taking further from last post Nifty and dow futures .We can see dowfut had already broken previous low whereas nifty was still trading above last low ,In last 2 trading days nifty too breached last low and today attempted a recovery.Lets see the chart.


The move is well within the parallel channel . Also a trendline from all time high crosses from todays low .This range of 11000-10950 seems important if we hold it can expect good up move. Wavewise an abc correction looks finished .Lets see tomorrows price action for more confirmation. 


Monday, September 21, 2020

Nifty and dow fut

Hi friends,

                    Dowfutures and nifty are in fractal move quite similar move.
lets see the two charts.


The above chart is nifty spot ,Can see the kind of wave move happened have showed with arrows,Lets see dow futures move.


The above chart is dow futures hourly chart ,Again here i have shown waves with  blue lines ,Just compare both charts move its quite similar ,Lil bit here and there variation may be there,But overall structure looks same .Dow futures is bit ahead of nifty chartwise it has already broken previous low ,Where as nifty is yet to break.

Monday, July 27, 2020

KOTAK BANK ELLIOTTWAVE COUNTS

Hi friends,
                   Lets look at the kotak bank move from march lows.


From the above chart we can see WX is done and Y is on ,Right now b of Y is on which is a triangle
move ,Upper break is at 1400 and lower breakdown is at 1260.According to WXY move ,Expectation would be a breakup ,Lets see how the stock performs in coming weeks.

Thursday, July 23, 2020

Midcap index stocks movement since jan highs

Friends,
                Midcap index was anyhow underperforming Nifty ,Nifty made a all time high in jan 2020 Whereas midcap index was still -15.3% down from all time high in jan . The fall from jan highs saw midcap index fall further by 41.9% towards march lows ,From march lows index has seen smart recovery with individual stocks doing quite good lets see how stocks have fared.


Out of these ESCORTS has outperformed big time rural agri theme. So even in pandamic few sectors have done exceptionally good need to dig in deep to find things. Even FMCG stocks did great BRITANNIA clocked robust volume growth thanks to increased consumption of biscuits.

Nifty50 stock movement since JAN highs

Dear friends,
                       Since jan highs stocks saw a steep fall going into march ,And started to recover.
Now we are in july and few stocks have already crossed jan highs ,Most prominently RELIANCE 
has crossed jan highs and have gone up by more than 20% above jan highs ,Which shows the out performance of nifty compared to other indexes ,As reliance holds 12.46% weightage.


Nifty is just ~9% down from its jan highs now ,Which was 39.6% down in march fall and had touched a low of 7511.


Sunday, July 19, 2020

JBM Auto Elliottwave analysis

JBM Auto ,The stock touted to be main contender in India's electric vehicle push.
Lets see how the chart shows wave structure.


The stock shows a solid 5 up on monthly followed by 2.5 yr long correction ,Still under slanting trendline.
The correction is still on in this,Though a good stock for electric theme lovers in dips.Keep eye on this once the abc of this impulse is done this could be a multi bagger.  

BankofBaroda elliottwave counts

Lets see the elliottwave counts for BOB from the lows.


From lows it has finished a impulse and has done a abc correction.Now as log as 46.80 holds a good upside is possible .Lets see how this performs.

Escorts elliottwave counts

The monthly elliottwave count for escort follows.
The chart is self explanatory.


The stock is doing good and has scaled alltime high .Its the flavour of the season with agri related sectors doing great .On monthly its in 5th wave.

Thursday, July 09, 2020

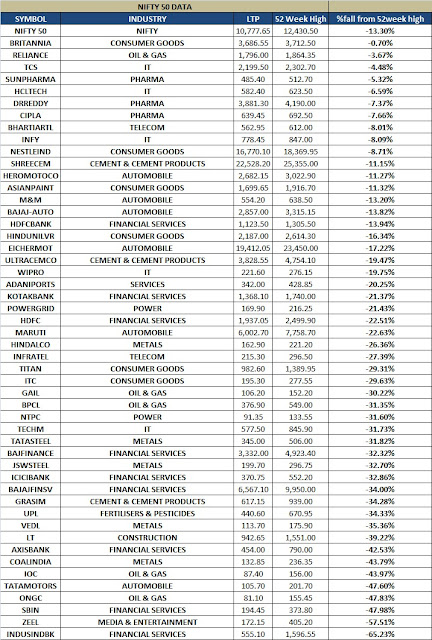
Nifty stocks fall from 52week high

Nifty 50 stocks fall from 52 week high the LTP taken is 9th july price during market hours .


Wednesday, July 08, 2020

METAL Sector rally from march lows


Metal sector rally from 24th march lows!!


FMCG Sector rally from march lows

How FMCG sector has performed since march lows!!

Saturday, May 02, 2020

Nifty sectors Weightage

As we all know nifty is a index which contains 50 stocks.These stocks carry their weight in nifty .These stocks are from different sectors ,Many are from same sector.Lets segregate them according to their sectors to find out individual sector weight age in NIFTY. 


S
The above table shows weightage of diffrent sectors in Nifty. We can see the main drivers of nifty are
four sectors according to weightage BANKING ,IT ,FMCG and OIL&GAS.

The top 4,5 sectors in nifty have almost 80% weightage in nifty.


Nifty heavyweight sectors
Banking sector  26.30%
IT Sector  15.09%
FMCG Sector 14.51%
Oil&gas Sector 12.48%
Finance  10.33%
Total 78.71%
Here if i club banking and finance we have a super heavyweight sector which has weight age of almost 37% .So the backbone of nifty is Banking and finance sector.Nifty cant move or fall for a long time time without favorable response from this sector. IT and FMCG are almost same weightage .So next time you try to figure out nifty trend or bias do go through the heavyweight sector stocks ,You would get good hints about it.


INFY UPDATE

In my last post ,Had discussed about a triangle unfolding in infy.


Lets see the present scenario.


From the last post after abc a triangle finished in d and now probably we have finished e.
Below 650 confirmation of e being finished. Expecting this to be in sideways to downward 
bias as long as yesterdays high is not crossed.

Sunday, April 26, 2020

Axis bank elliottwave analysis.

 Lets look at axis bank wave structure.

The bigger timeframe 


Lets look at the structure of rise from the lows. 


This looks interesting ,Structure looks quite clear and is well labled. 360-70 looks good support 
as lomg as that holds a bullish count remains active for upside .Lets see how the price moves in coming days.

Sunday, April 19, 2020

TCS elliottwave analysis

Taking further from old post IT stocks.
Lets see TCS structure.


The TCS waves showing lot of abcs ,Here the ideal count i have labled ,As long as a high above 
the dotted yellow line is not done this count is valid.Still we can see rangebound moves for a while and then a trending move.Would update on this as the move matures.

INFY elliottwave analysis

Taking further from old post on IT stocks .

Lets see structure of INFY.


The present structure shows multiple counts .We had an abc finished near 680 levels and from there
we could be trading in a triangle or a new abc need a day or 2 more price move to zero in on popular 
count .Would revist this soon.

Tuesday, April 14, 2020

ESCORTS UPDATE

The escorts pattern is opening up.Look at the old post Escorts elliottwave .

Lets see the present structure.

B wave probably unfolding into wxy ,y wave unfolding which has potential to do 750-760.

Lets see how the price moves in coming days.

Saturday, April 11, 2020

Escorts elliottwave analysis

Lets look at wave structure of escorts.
Lets have larger time frame first.


Larger time frame shows 123 is finished and 4th is on.Lets see the lower time frame to see 4th unfolding wave structure.


The above chart gives hint of  WXY unfolding its trading in a parallel channel. WX is finished Y is unfolding with a already done and b underway .b is usually notorious plays around for some time before giving up not to forget it catched lot of traders on wrong foot .Look for shorting opportunity in coming days in this in rallies.This wave structure fails if stock crosses above parallel channel.

Friday, April 10, 2020

mindtree elliottwave analysis

Friends,
               Lets look at wave structure of mind tree ,First always look at bigger time frame to figure out bigger wave and later check on smaller time frame to figure out entry exit in case a trading or investing opportunity arises looking at larger time frame.


The monthly wave counts show clear 5 up. According to this study this stock would underperform for quite some time ,This validates what we saw in IT INDEX ELLIOTTWAVE ANALYSIS .

Lets check now smaller time frame .


From 5th high we can count abc followed by X wave and again a down fall probable WXY pattern unfolding .A rectracement rise would be a welcome move for berars to hit for lower levels next few 
days move can give good entery point lets see how the stock behaves in next week.


Thursday, April 09, 2020

IT STOCKS

Dear friends,


Lets look at IT index waves,Almost all indexes this time fell along with nifty . After the initial fall the indexes have shown some good replacements lets look at the wave structure.


It made a wedge and fell almost all made wedge kind overlapping wave structures distribution before collapsing .Lets take a closer look at the correction .


This abcde overlapping upmove has potential to do minimum 13000+ and maximum 13450.
Thats where a good short trade setup would emerge i think ,Lets see how this moves in coming days .