Thursday, February 27, 2014

Nifty Trade strategy

Hi friends,
                 February series ended on a high .I had posted a expiry View Nifty expiry.
Nifty expired on said direction,Now a new series in on lets see how waves unfold.
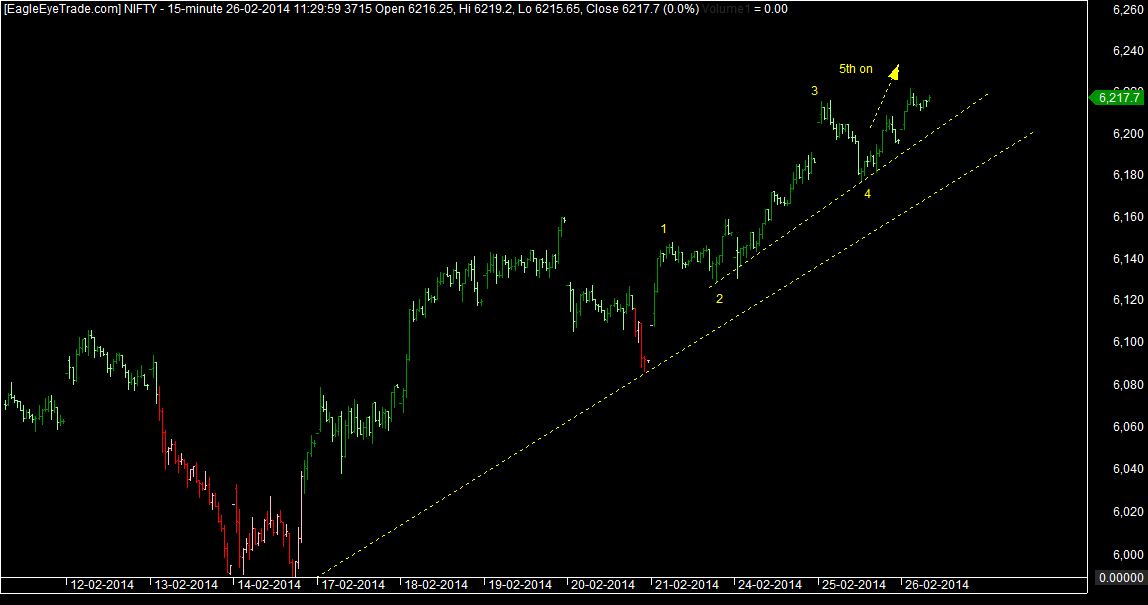
Lets look at the present chart structure.
Nifty Trade strategy
We are in 5th of
impulse of lower
degree and it can end
anytime.The options
we have according to
elliottwave is shown
in the chart.
Lets look at the lower
time frame chart
to have a better look
at the structure.

Nifty Trade strategy
As long as nifty remains
above 6215 it seems fine.
Below 6215 first sign of
weakness .Below 6160
trend would get negative
else we can rise back
from 6160 .Lets see how
nifty behaves in next
few days it would
show the roadmap


for next few weeks .

Regards
Rish

HDFC Bank Trading Strategy

Hi friends,
                   Today i would try to count elliott waves of HDFC bank.
This is super heavy weight in Nifty as well as bank nifty.
So knowing about this movement helps much in nifty movement.
Lets see the chart of HDFC BANK.
HDFC Bank Trading Strategy
We can see from the chart
my expectation wave wise.
I think we are in e leg of
larger degree wedge or
diagonal.
As long as the stock holds
above 650 a rise towards
700-720 is open ,We should
have a dip coming in from
680-690 levels towards


650 making b wave after a .Lets see how stock moves in coming days.
Regards
Rish

Wednesday, February 26, 2014

India VIX Future Trading

Volatility Index is a measure of market’s expectation of volatility over the near term.
India VIX is a volatility index based on the NIFTY Index Option prices. From the best bid-ask prices of NIFTY Options contracts, a volatility figure (%) is calculated which indicates the expected market volatility over the next 30 calendar days. India VIX uses the computation methodology of CBOE, with suitable amendments to adapt to the NIFTY options order book using cubic splines, etc.

Recently NSE  Starting trading in India vix
Though its costly,Not meant for retail investors: The contract value would be minimum Rs. 10 lakh, so is unlikely to be evoke interest from retail investors.

Lets see the India VIX chart.
India VIX Future Trading
From the chart we can see
the vix is forming
abcde and is in ending stage.
It should bottom near 12
and then head towards
16.
Above 16 it would be a
breakout and it can
travel much above
so as of now first hurdle


in rise would be 16.

Regards
Rish


Nifty February expiry

Hi friends,
                    In lower time frame nifty is finishing an impulse
we can see from the following chart its in 5th of impulse
of lower time frame ,We have targets as 6220-25 and above
that 6260-65 above that .
Nifty February expiry
A fall below 6200
would be first sign of weakness
wher as a fall below 6180
would confirm the weakness.
Trade wisely.


Regards
Rish

Tuesday, February 25, 2014

IDFC The Banking license hype

Hi friends,
                   Looking at IDFC the front runner for Banking license.
Lets look at the chart does it show something exciting ?
Below is the daily chart of IDFC.
IDFC The Banking license hype
The chart suggests the
stock is near to the
slanting trendline
resistance and nothing
extraordinary in volumes
yet.
Let me pul out one
more chart of lower
timeframe to get a
better look at the
present structure.

IDFC The Banking license hype
From the hourly chart
we can see a small
triangle in formation
and right now we
are in e wave down
The support lies at
lower trendline ie 93.80
and breakout resistance
at 98.90.
Ideal trade would be to
buy as near possible to

the support of 93.80 stoploss of 92.80 above 98.90 this can go towards 106+.
On downside below 92.80 the stock gets weak.

Monday, February 24, 2014

Nifty enters the gap area

Hi friends,
                  Nifty continues to move up after small abc ,Its entering
the gap area and also the important retracement zone of 61.8%
and 78.6% ,Usually nifty reacts to this range before reversing.
Lets look at the chart.
So nifty should
resist 6190-6200
range above that
it can stretch towards
6260 ie it would try
to close the gap.
Lets see tomorrow
how 6200 range reacts


I of the opinion the upmove is corrective in nature,Above 6260 only i would
consider alternate count.
Regards
Rish

Sunday, February 23, 2014

Larson & Tubro Elliottwave Analysis

Hi friends,
                  Looking at Larson chart ,This chart was range bound for much time
Slowly it came out of range now targeting 61.8% retracement .of the fall from
1155+ to 950+.
Lets look at the chart to have a closer look.

Larson & Tubro Elliottwave Analysis
From the chart we see
we have finished one
big abc from 1155 to 950
and then a counter trend
rally is on which is reaching
almost 61.8% retracement level
On labeling wave ,I see we are
in 3rd of c and can see 5 wave
in 3rd wave ,We should be
finishing 3rd on Monday


Any rally on Monday should be used to see for a wave 4 fall and if 1016 is broken it can even stretch.
My expectation would be to short any rally i see on Monday .

Regards
Rish

Friday, February 21, 2014

Axis Bank elliottwave Analysis

Hi friends,
                    Looking at Axis bank ,I see a small impulse on hourly time frame.
First lets look at the bigger picture of Axis bank.
Axis Bank elliottwave Analysis
From the chart we can see
it has made abcde from
september 2013 low
After finishing abcde
we did 1 small abc
in it And after that we
are doing a small impulse
in it.Lets look at the
smaller time frame chart
to get a better look at
the hourly impulse.

Axis Bank elliottwave Analysis
We see that a impulse
is in ending stage in
hourly timeframe
we can try a small
option trade or a short
trade in it on monday
near 1200 for a target
of 1150 or lower
we can even try 1150
put which is quoting
at 4 right now

Stop loss for this trade would be 1230 .

Regards
Rish

Thursday, February 20, 2014

Nifty elliottwave patterns

Hi friends,
                   Nifty keeps us guessing ,Yesterday it stretched above 6130 and today it fell below
6100.In my last post i had expected this fall though levels were not matched perfectly.
Look at the old post Nifty Technicals.
Lets look at the present structure of nifty Index.
Nifty elliottwave patterns
If you see the last post
chart the fall has come
I would look for a bounce
back from 6060-50 levels.
The chart is self explanatory
If we go below lower
trendline then chances of
this pattern failing gets
high.
Lets look at one more
possibility which shows

same price movement but elliott wave counts differ.Lets look at the chart.
Nifty elliottwave patterns
This count assumes we
had c wave failure in
W ,ie c low was not
lower than a wave low.
This wave count too
suggests a fall till
6060-50 in fall of b
wave ,This abc would
be part of x wave.


Lets see how nifty moves in next few days .

Regards
Rish

Tech mahindra Trade set up

Hi friends,
                  I think we have a small Trade setup in Tech mahindra.
Lets look at the chart.
Tech mahindra Trade set up
From the chart we
can see that we finished
a squeeze abcde at 1700
levels and from there we
did a impulse up till
1880,And started a
correction for that we
have done a down and
b up now we in c down
Here we have a small


trade we can initiate a short at current market price or in rises stoploss at 1861 and
targets as 1778 and 1727 in case the wave stretches.
Lets see how the stock performs in coming days
Regards
Rish

Wednesday, February 19, 2014

BANKNIFTY Move stretches

Hi friends,
                  Had posted banknifty chart expecting a=c ie c finishing near 10440+
but the wave is stretching and we are nearing 161.8% ie 10688+.
Lets look at the chart.
BANKNIFTY Move stretches
From the fib extension
we see 161.8% comes
at 10680+ we are in
striking distance of it.
This is resistance zone
we would reverse if
we fail to cross this
level ,Tomorrow if
you see this level on
screen short it with


50 point stoploss .If we continue the upmove then ,I would consider this as impulse
And would adjust the count accordingly.

Regards
Rish

Tuesday, February 18, 2014

Nifty index technical analysis

Hi friends,
                   In my old posts i had mentioned about retest of 6100-6130
So we have tested 6130 today,Look at old post here Nifty structure.
Today nifty tested 6130 and closed above that its hovering in resistance
zone ,If my assumption of wxyxz is true we need to reverse soon from
this range,Lets look at the chart.
Nifty index technical analysis
The green dotted line
is my preferred scenario.
I see nifty to fall from
this range towards 6090
6060 range and rise back to
6130+ to finish abc of z
wave ,Lets see how nifty
performs ,If nifty continues
to rise and heads towards 6190
i would have to change my count


Lets see if nifty follows green dotted line or continues upward journey.

Regards
Rish

Monday, February 17, 2014

Bank nifty moves in range

Hi friends,
                     I had posted Bank nifty analysis few days back ,After finishing
the abc it again started up move though still range bound,Lets look at the chart.
Bank nifty moves in range
From the chart we see
after finishing green
abc ie B of bigger
degree the bank nifty
rallied for c wave up
now if a=c we have a
target of 10440+ .
If it stretches we will
see so as of now we
should target 10440+


on banknifty ie trendline resistance as well as a=c target.

Regards
Rish

Nifty Intraday 17th february

Nifty continues to be sideways at resistive trendline.
I think nifty would spend today and most part of tommorrow
at this range only and make some pattern,A triangle or a abc
triangle is more justified if nifty has to spend more time.
Nifty Intraday 17th february
Avoid trading till its
in range its just gonna
take stoplosses both sides.
Yes stock specific action
going on.


Regards
Rish

Sunday, February 16, 2014

Nifty technicals 17th february

Hi friends,
                   According to my old post on nifty,I expected bounce back as long
as nifty held 5965 ,The nifty fell till 5984 and reversed.
Lets look at the present structure of nifty.
Nifty technicals 17th february
From the chart we can
see that the nifty has retraced
till the trendline resistance
If we trade above 6060
we have potential to go
towards 6100+ ,If we fail
to cross 6060 tomorrow
we should remain sideways
in the range 6060 to 6000.
Lets see how nifty performs


Tomorrow .

Regards
Rish

Mcdonalds Trade setup

Looking at the Mcdonald Technical chart ,It looks like it has finished a triple zigzag
correction and has reversed to touch higher levels.
Lets look at the chart.
Mcdonalds Trade setup
 Ideal trade would be
to buy some now and
rest in dips stoploss
a tad below 93,
respective targetswould
be 97 and 99 .
Lets see how Mcdonalds
moves next week


Regards
Rish

Trade ideas we discussed

Hi Friends,
                    Lets see how the Trade ideas we discussed have done this week.
1)ONGC ,The trade idea was ONGC long for a target of 283 .
     Stock did 283 and retraced back.

2)Ultratech, The trade idea was ULTRATECH Short ,The trade was active
    below 1700 and it has already done 1650 ,Continue to hold this short for
    1600 with trail stoploss at short price.

3)Dr Reddy,The trade idea was Dr Reddy Long,The stock was expected to
   touch 2700 ,It exactly touched 2700 and reversed from there.

So over all all stocks moved in expected direction ,Apart from this ,I had
given two commodity trade ideas on Gold and Silver.
Both were expected to breakout towards upside ,They brokeout and ran up.
Gold long and Silver long. Gold took less time to run up but silver took
some time to find its way upward.


Saturday, February 15, 2014

Silver Breaks out

Hi friends,
                  I had posted about coming rise in silver ,Though it took some time
to comeout of range eventually it has come out of it.
Look for the old post here Silver chart.
Lets look at the chart now and see how things have changed.
Silver Breaks out
From the chart we see that
silver has done the minimum
target of 21.50$.Now the
next targets come at 23 and
25$.
Which should come in coming
weeks,Any one who took
position on my recommendation
should trail position with buy

As trail price ,And wait for 23$ and eventually 25$.

Regards
Rish

Friday, February 14, 2014

Gold breaks out

Hi friends,
                  I had posted gold positional chart some time back and had mentioned
about coming breakout in Gold chart.
The breakout in gold has come already and the trade is already in handsome gain.
Lets look at the present chart.
From the chart the
breakout is seen,Next
hurdles 1335,1394
and then finally 1390
for now should trail
the position with 1280
as trailing stoploss or
can book some profit


and hold rest with buy price trail for the targets of 1335,1394.Lets look at the chart
closely.
We can see from the chart
gold did 1st wave up and then
a small wave 2 and now
trading in 3rd wave with
targets of 1335 and 1394
Lets see how gold
performs in coming
days.


Regards
Rish

Thursday, February 13, 2014

Nifty elliottwave counts

Hi friends,
                   I had been telling about this move for some time ,Below 6080 it was evident
As mentioned in previous posts Nifty structure and Nifty technicals.
Now the present situation we finished WXY ie a double zigzag correction.
Lets look at the chart.
Nifty elliottwave counts
My reading says if we reverse
before 5965 itself we have
a chance to retest 6100
if we go below 5965 we would
have a lower top.Ideally i would
see tomorrows move to fine
tune my reversal levels.
Most banking stocks got badly
hit today.
Lets see how nifty performs


Regards
Rish

Nifty structure 13th february

Hi friends,
                   Nifty at last gives some trending move which suggests y got over
look at old post nifty structure .
Nifty structure 13th february
Expecting this drop max
till 6030 or 5980 and then
again reverse to make
a rally towards 6100+
to finish wxyxz ie
tripple zig zag.
Lets see how nifty
performs


Regards
Rish

Bank nifty structure

Hi friends,
                  I had posted banknifty chart few days back .The index didnot move
that way though its a small range so it didnot affect  .
Lets look at the chart now and count the eliiotwave counts.
Bank nifty structure
From the chart we
see we had a sideways
triangle which broke
upward ,As long as
10275 is maintained we
can expect another rise
else c would be considered
over below 10275.
Nothing much to do
as of now small range
stock specific action is on.

But soon we would have trending move.
Regards
Rish

Wednesday, February 12, 2014

Hindunilever Technical Chart

Hi friends,
                   Looking at Hindunilever technical chart .We can see from
the chart ,If finished a small impulse from march 2013 till july 2013
A fast impulse ,And after that its in a long correction slow one,Lets
see the chart.
Hindunilever Technical Chart
The correction is
taking the shape of
a squeeze abcde ,We
have finished abc and
right now trading in
d wave which is
expected to finish by
590 -600 we have
tested 590 once
looking for a retest again


Else below 550 its poised to see a new low 530-520 levels in e leg ,Look for shorting
the stock in rises with stoploss above 610.

Regards
Rish

Nifty technicals

Hi friends,
                  Nifty broke out of small squeeze or triangleNIFTY today morning
and now it came back and retested the breakout trendline of triangle
now if it holds tis line we are in for  a test of 6130 .
Fail to sustan 6080 can cause a fall towards 6060 and below that
6030.
Nifty technicals


Lets see how nifty performs

Regards
Rish

Tuesday, February 11, 2014

Nifty Index update

Hi friends,
                    Had posted during market hours,Had expected fall after intra high.
Fall came but not till 6020-30,Check the afternoon post Nifty index.
Lets look at the chart now.
Nifty Index update
Right now nifty is resting
on lower trendline of the
squeeze ,Tommorow the
squeeze should break
need to see which side it
breaks ,Labeling waves
become a very tedious
job when the range gets
squeezed.So idealy
below 6055 we should
head for 6020-30 and

above 6085 we should target 6100-6130.

Regards
Rish

ONGC Trade setup

Hi friends,
                   Looking at ONGC chart ,It gives us a opportunity to trade long.
Lets look at the elliottwave counts on the chart.
ONGC Trade setup
If we see from the chart
we have seen a small
impulse followed by a big
abc correction.
Here we can hav e a smal
long in dip around 272-270
for a target of 283.
Above 283 the stock can
do very good ,For the time
being 283 would be the


target stoploss would be 265 ,Lets see how ongc performs.

Regards
Rish

Nifty wave structure 11th february

Hi friends,
                     As the waves unfold we get things clear ,Had expected a small upmove towards
6100-6130 which is on right now as i write.I expect it to loose strength any time during this upmove
and head towards 6030-20 ,We would again evaluate near 6030,To see further move.
Nifty wave structure 11th february
 Lets see how nifty behaves
at these levels and would
figure out next move in
it.


Regards
Rish

Monday, February 10, 2014

Bank nifty Elliottwave Analysis

Hi friends,
                    Banknifty stocks holds the most weight age in nifty,So mostly
we see banknifty has a bigger say in Nifty directional move.
Lets see the banknifty Bar chart and try to count its waves.
We look from the chart
we have repeated abc correction
A possible case of
tripple zigzag ,We would see
how it unfolds ,As of now
my expectation is a fall to
any of yellow line levels
and bounce back to 10400-10450
levels ,There i expect the pull
back rice to finish.


Lets see how Banknifty performs in next few days.

Regards
Rish

Ultratech Trade strategy

Hi friends,
                   Ultratech has been following waves perfectly ,I tried few trade setups
on it and all were successful,Now here again Ultratech is on important juncture .
Lets look at the chart.
Ultratech Trade strategy
This is daily chart
from the chart we
can see that its forming
a tripple zigzag wxyxz.
I had mentioned few
trade setups in it,They
were based on X wave
move you can check
the trade setups here.
Ultratech trade setup.


Coming back the the above chart we are in c wave of X ,Now the important section
Where to short for Z wave fall,Lets get a closer look at the X wave.
Ultratech Trade strategy
From the chart we
can see,The c leg
target if a=c would be
1770 as of now we
are trading at 1720+
Either short below 1700
or look to short near
1770 for a new low
below 1640 atleast.
If you short below 1700
stoploss would be 1740.

For 1770 we have to see still as we are yet to reach there,Keep an eye on the stock.

Regards
Rish

Sunday, February 09, 2014

Nifty Technicals 10th february

Hi friends,
                   Nifty after making short term bottom managed to crawl up slowly.
Look at the last post nifty technicals.
At present nifty is in complex upmove its better to give it some
more time before labeling the wave counts.
http://rishtrader.blogspot.in/2014/02/nifty-corrective-up.html
As of now looking for
nifty to loose strength
at 6100-6130 and start
to drift down ,Most
heavy weights show
that we could be finishing
A wave up,We should
know about it by monday.
Overall the pattern still
remains corrective


but with positive bias for  now,Stock specific action should continue to happen,Would
post the counts in detail as the waves un fold .

Regards
Rish

Saturday, February 08, 2014

TCS TRADE STRATEGY

Hi friends,
                        We have more clarity coming on tcs chart as the move progresses
Go through the following chart
TCS TRADE STRATEGY
The chart shows formation
of tripple zigzag on the
hourly time frame.
We have finished wxy
now x wave is on and
expectation is once 2187-90
is crosses we should test 2230
2240 and then reverse
to finish off x wave.
After that the final z can


start off so right now we have a long trade with a small stoploss at 2100 for a target of
2187-90 and once crosses 2230-40 .

Regards
Rish

Friday, February 07, 2014

Technical charts we discussed

Hi Friends,
                   Over last month we discussed many stocks lets see how they performed.

1)IDFC The stock didnot follow the exact said path ,To understand further first have a
   look at the old post IDFC Technicals.
   Expectation was a  move towards 105 then a fall to 95 tentatively
  The stock did 101.50 and then fell below 90 and now trading at 97,
  So overall direction was fine but not in sync properly.

2)FRL This went otherway and hit the stoploss the chart reading went wrong here.
   Look at the post FRL Technicals.

3)Ultratech did exactly as was anticipated and we had trades bothways here
   ie both long and short.
   First we longed from 1690 to 1730 the post was Ultratech Technicals.
  Once 1740 was done and not crossed we had a short trade on our hands
  1730 to 1660 As shown in this post Ultratech Update.So overall this
  stock did perfectly both ways.

4)TCS Long trade was expected and did perfectly,See the old post
    here TCS Technicals.Adip was a buy we got a dip till 2145 and then
   we rallied till 2180+ almost testing 2187 resistance.

5) TATASTEEL A long trade was expected here Se the old post here Tatasteel technicals.
     A rally was expected till 360+ and it did 360 in hurry and it has even
     crossed that.

Thursday, February 06, 2014

DrReddy Technical chart

Hi friends,
                     Looking at Dr reddy technical chart ,The stock has been rangebound
for some time now after a good rally.If we count waves from 2400 onwards,We
can see that the stock is very well in process of making as impulsive move.
Lets look at the chart.
DrReddy Technical chart
From the chart we
can see that we had a
simple abc correction
in wave 2,and presently
in 4th wave having a
broadning formation
downwards abcde
with today forming the
e leg we have a trade set
up here for a long.


A long can be initiated in the stock at 2600 and lower for a target of 2700
stoploss would be 1st wave top ie 2555 ,So to have a good risk reward ratio
try to buy nearer to stoploss.

Regards
Rish

Nifty Corrective up.

Hi friends,
                    Nifty after making short term bottom
continued its up move in wild swings ,Which makes me
feel its corrective up which looks like this in chart.
Nifty Corrective up.


Nifty would be strong only above 6100 otherwise it can swing back
to continue its correction to lower levels.

Regards
Rish

Wednesday, February 05, 2014

Bharti Airtel Long term Technical Analysis

Hi friends,
                   Revisiting Bharti airtel long term Technical analysis,Had posted this last
in November 2013 ,To visit old post go here Bharti Airtel .
Stock has traveled some distance in its e wave fall from 350 it has already tested
300.
Bharti Airtel Long term Technical Analysis
This stock has been moving
in this squeeze from 2007
so once it breaks that a nice
trending move is possible
in this stock.
Ideal strategy would be
to buy in dips for investors
every dip accumulate for
handsome gain ,My tentative
target for this stock bottom


is 270-250 ,Plan accordingly breaking below lower trendline looks quite rare,But we are in stock
market so need to have some stop in place even for investment ,Below 200 i would be worried about my investment and would look to dump it in rise.Looking for what fundamental push would
make Bharti to give that push up Retail??Fingers crossed.
Regards
Rish

Tata steel short term trade

Hi friends,
                   Tata steel gives an opportunity to gave a short term trade setup in it.
It looks to me a falling wedge or ending diagonal in happening in it.

Tata steel short term trade
 Trade idea would be to buy the stock in dip around 344-345 with a stop loss
below 333 first target 360.

Regards
Rish

Tuesday, February 04, 2014

TCS Short term trade

Hi friends,
                    TCS has made a nice squeeze on hourly chart
abcde which can be seen in following chart.
TCS Short term trade
Looking at the chart we
can see that todays low
after gap down finished
e leg of the squeeze.
Now above 2187 stock
would gain strength ,Once
it crosses 2187 it can target 2250.
Ideal trade setup would
be to buy in dip or buy above 2187
stoploss would be below 2130.


Lets see how tcs responds ,Above 2250 it would be a breakout and a positional trade
so first hurdle 2187 second hurdle 2250.

Regards
Rish

Monday, February 03, 2014

ICICI BANK Technical view

Hi friends,
                   Looking at Banking heavy weight ICICI BANK Technical chart,It can be easily figured
out from the daily chart we did abcde from august end 2013 to early December 2013.
Lets look at the daily chart.
ICICI BANK Technical view
The red line shows the abcde
after abcde we have a fall
which as of now can be classified
in impulse down as well as
complex correction.Impulse
down would be more bearish
thing,As of now lets assume
complex correction on and lets
see the hourly chart to see the
fall closely.


The impulsive fall from e top would be damm bearish scenario ,Me taking the fall as
complex correction as shown in following chart.
ICICI BANK Technical view
From chart we can see that
we have done one abc ie w
followed by a X wave and
again we in a fall which should
finish by 940 ,Its good support
fot the stock,I expect a nice
pull back from 940 level
but that would be a short term
bottom only according to me .
Wxy is forming we have done


W and X right now a of Y is going on which is in final stage of its finishing,Track this
stock for short term bounce once 940 is touched.

Regards
Rish

Nifty Technical chart 4th february

Hi friends,
                   Nifty gave a small blip up from A=C area ie 6070-50 level ,We rose
from 6020 to 6100+ levels and again fell below the january expiry day low.
We have gone below A=C level ,So looking at the second level .
Look at the following chart.
Nifty Technical chart 4th february
The 127.2%  comes at
5990-5980 ,Below which
we target 161.8%  which
comes at 5890 odd levels.
We have tested 127.2% today
the price chart suggests
exhaustion in price momentum.
Though the lower time frame
charts still don't give any
concrete confirmation of


reversal yet, Don't be in a hurry to buy till we see a clear reversal,Usually 161.8% gives lot
of confidence lets see what nifty does this time.
Regards
Rish

Sunday, February 02, 2014

What to do when stop losses hit continuously

Hi friends,
                  As the topic says "What to do when stop losses hit continuously"
There is no sure shot thing to come out of this situation,Its a painful situation.

A lot goes through a traders mind during that phase,
What wrong i am doing ?
Did i analyze the scrip wrongly?
Did i force the trade ? etc etc.

And all this time the calculation of loss continuously happens in
background ,So with each new stoploss hit the urge to win back becomes
stronger and stronger.
Eventually trader think to win back most of the loss in a trade and ,Thats how
he increases the stakes on trades and if the loss continues it adds to the agony.

I have managed to come out of this situation only by decreasing my stake on
each trade ,Till in get my winning rhythm back.
How you come out of such situation!!

If you do something different to win back do share your methods.

Regards
Rish 

Saturday, February 01, 2014

Ultratech Technical chart Update

Hi friends,
                  On friday i had posted Ultratech Technical chart .I have figured out
the following count is valid too till we don't breach past 1730,Have a look at the
following count on chart.
Ultratech Technical chart Update
So any trader who has
taken position on old
post please make sure
you have stoploss on
buy price for now.
We can be riskfree
only above 1730
else this would come
down again.This looks
to me as a B wave triangle


So traders keep an eye at 1720-1730 .If thats not crossed comprehensively
we very well have a short trade too on our hands.Trade wisely.

Regards
Rish

Trade set up Elliott wave ABC Correction.

Hi friends,
                    Today i would give a simple example of how if one is able to count waves ,Rewards
are brilliant.
I would discuss a simple abc correction ,If one is able to count this ,This gives an excellent
trade setup with low risk.Look at the following chart.
Trade set up Elliott wave ABC Correction
I have labeled in red abc yellow show internal 5 wave structure of c wave.
This chart gives us so much information about abc setup ,The 5 wave in c wave gives
us confirmation that c wave has ended.  A green trendline made by joining 2nd wave and
4th wave high gives breakout confirmation for a new wave ,Also the horizontal redline
gives confirmation that a new up wave has indeed started ,As it negated the posibility
of a 4th wave rise from low.
A ideal trade setup what comes out from this set up would be to buy the stock at the break
of green trendline with a stoploss at c low and continue tralling up once red line ie 4th wave
negation .
All it takes is to go through all charts and shortlist prospective trade setups and track them
during market hours for favorable move and pounce on them once things are in your direction.
I have seen many say trade setups recognition is not easy in elliottwave ,Well if it was that easy
it won't work in markets,It a truth the more the pattern is visible lesser the probability of
its success.Lastly there is no prosthetic for hard work.