Showing posts with label Trade setup. Show all posts

Saturday, February 18, 2017

>Granules elliottwave

Hi friends,
                  weekend post is granules ,The pharma as a whole is not the flavor right now,Who knows the sector can surprise soon.
I am posting weekly chart of granules the waves are so clear,The impulse started after 2008 carnage is still on with 5th wave pending.
The stock witnessed multi year 3rd wave and right now consolidating in a probable 4th wave triangle 
after which the pending 5th wave can take stock towards 200+ levels.A trader should make a position above 148 which points that the triangle has been overpowered and a smooth move towards target could come.As a investor the stock should be bought in dips .


Thursday, February 16, 2017

>Petronet TRIANGLES

Hi friends,
                   Petronet has been trading in triangles for some time now.
First it was in a bigger triangle from last october till late jan 2017 ,It did break that triangle but again started to consolidate in a smaller triangle .
look for a fast move soon as its been consolidating for long time,367 is support for the stock and above 393 can move towards 420 and further towards 450.

Friday, February 10, 2017

>INFO EDGE (NAUKRI)

Hi friends,
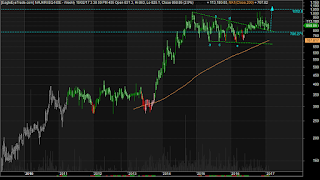
                  Infoedge was trading in a triangle for more than 2 years.


The squeeze is getting time consuming big move should come soon according to chart ,
As long as 786 holds a move towards 1000+ is open .

Tuesday, February 07, 2017

>HCLTECH Trade setup

Hi friends,
                  The following is hcltech hourly chart.
i am sharing a small portion of chart which shows a promising pattern this is to show how to come to a trade setup using elliottwave analysis.
From the chart we can count clear abcde up which is followed by a good time consuming abc till 780.From 780 we had a sharp rally till 835 levels and after that the stock is consolidating .
Trade setup here would be to buy this stock in dips till 780 is saved target would be around 870-880 levels,Track this stock in coming days to see how this moves .

Sunday, February 05, 2017

>PNB Gilts target

Hi friends,
                   Timing in stock picking matters alot ,pnbgilts kept oscilating in a triangle for 8 years.
Must would have frustrated someone who entered in 2008.
This perfect example which shows pattern in bigger timeframe ie monthly.
Look at the clear 5 waves in a triangle abcde .
The stock broke out after 8 years of consolidation and is set to reach triple digit in coming time catch this stock in dips if you get one :).
This breakout is backed by huge volumes which gives more confidence about the follow though .

Track this stock and try catching if you get a good dip in this.

Thursday, January 26, 2017

>Astra microwave elliott wave counts

Hi Friends,
                    Astra microwave has been sideways for last 2 years now,Consolidating in a triangle.
In wave terms we can say its consolidating in a 4th wave triangle.


The triangle looks prominent as even volumes have dropped considerable giving hint of a triangle pattern.
The breakout from triangle is at 140 above that this can easily do 180 levels. For an investor its a buy for a trader buy after breakout.
This is a defense sector stock ,With make in india being the current flavour this can be a dark horse keep this on radar.

Friday, May 27, 2016

>DCB Elliott wave count

Hi Friends,
                       Looking at DCB a text book 5 up move is anticipated.
Look at the move from the basing of 70 ,we had a 1 up and abc down and a big rally till
100+ and then the stock went into consolidation.
This consolidation looks like a 4th 
wave fall,
Expecting a 5th up rally in it after 
this consolidation is over ,Keep this
on radar to look for a rally towards 100+
and further towards 110.


Wednesday, May 25, 2016

>DIVIS LAB elliottwave counts

Hi Friends,
                    Divis lab looks to have finished a wxy correction on daily chart ,
We can look from the chart how beautifully multiple abc's are nested together to form the pattern.
Now the present move also looks like as abc is ending and a move towards 1100 is due,As long as
1000 is held .
A wave trader always anticipates the move ,lets see how the chart pattern works in coming
days .Overall the pharma sector as a whole has not done good in may month ,Lets see whats in store
for JUNE month.

Tuesday, May 24, 2016

Info Edge(Naukri) Trade setup

Hi friends,
                    Have been tracking Info edge (Naukri) for some time now ,This stock is trading in triangle and has been getting squeezed ,I like the pattern as long as the lower trendline 700 holds this 
stock can hit atleast 850 ,Above 850 its a triangle break and should do 1000.


Tommorrow being the result day for INFO EDGE lets see how it fares ,I think its all set to rally if no negative surprizes in result technically the stock looks nice.

Sunday, February 16, 2014

Trade ideas we discussed

Hi Friends,
                    Lets see how the Trade ideas we discussed have done this week.
1)ONGC ,The trade idea was ONGC long for a target of 283 .
     Stock did 283 and retraced back.

2)Ultratech, The trade idea was ULTRATECH Short ,The trade was active
    below 1700 and it has already done 1650 ,Continue to hold this short for
    1600 with trail stoploss at short price.

3)Dr Reddy,The trade idea was Dr Reddy Long,The stock was expected to
   touch 2700 ,It exactly touched 2700 and reversed from there.

So over all all stocks moved in expected direction ,Apart from this ,I had
given two commodity trade ideas on Gold and Silver.
Both were expected to breakout towards upside ,They brokeout and ran up.
Gold long and Silver long. Gold took less time to run up but silver took
some time to find its way upward.


Thursday, October 15, 2009

>Clear 4th wave of local impulse

As pointed earlier 4th wave underway of local move as the day progressed the move got refined
and we can clearly see what happened can clearly read abc of 4th wave.

expanded flat 3,3 5 see how clear 5 waves in c.


RESEARCH REPORTS

>Nifty analysis Intraday 15th october

So it was confirmed it was an Impulse the current wave structure shows
4th consolidation is underway before 5th up of the present local impulse
Buying into the dip near 5100 should reap good gain.

wait patiently before trade setup emerges.Move could be anywhere between 60-100 points.

Regards
Rish
RESEARCH REPORTS

Wednesday, May 20, 2009

>ONGC Technical Analysis

ONGC looks to have done its upmove has completed a Impulse up.
Can expect a consolidation followed by a fall in the stock price
Upper side 1100 remains the hurdle ,Above 1100 this count
would not hold true.


The Trade idea would be sell on rises till it remains below 1100
A retest of 920-900 on cards.
The present move has come on high volumes which could be a distribution
if stock fails to cross 1100.

Read what research houses say about ONGC

ONGC (DEUTSCHE BANK)


Do comment if you have the contra view or same view
with your projected targets...


Regards
Rish
RESEARCH REPORTS

Monday, May 11, 2009

>Indian IT sector analysis

IT sector biggies INFOSYS, TCS and WIPRO ,The big three of IT Index
whose movement shows the way to CNXIT index .

Fundamentally nothing much changed on paper about valuations etc IT bound to
face margin pressures as spending has reduced drastically.

Old saying Market discounts things in advance..

ELLIOT wave analysis on three biggies show that the three are moving in unison
and probably trading in fourth wave,Which suggest buying in dips is a wise choice
still some time before Traders think of taking positional short trades.

The above charts show the similarity between the big three's wave structure.
So as far as IT is considered its a buy in dips till something drastic happens,
Though the buy need to be timed so that we get the stock near 4th wave end,
A good Option trade too possible here buying immediate out of money call near
4th wave end:).

See what research houses say about IT Sector

India IT Services (GOLDMAN SACHS)


So till next post try to trade them accordingly will try updating if things go other way.

Regards
Rish


RESEARCH REPORTS

Tuesday, April 28, 2009

>Maruti Suzuki Technical Analysis

Maruti Suzuki (MSIL) has outdone street expectations as volumes have rebounded (up 17%yoy) in Q4FY09 on a high base.

Which fueled nice rally in the whole automobile sector ,Maruti itself saw nice swift one way
rally ,The present wave structure suggest ongoing
correction can still continue.

Maruti can be shorted in rises (835-840) could be a perfect short with sl at 872
downside target at 750 a nice 70-90 points with risk of 30 points.
Keep eye on other auto stocks too they usually move in unison.

Check what Research houses say about Maruti.

Maruti Suzuki (IDFC SSKI)

Regards
Rish
RESEARCH REPORTS

>Oracle financial services software Technical Analysis

Oracle financial services saw 100%+ jump from 400+ odd levels in approximately
3 months.

Oracle financial presently trading near resistance.
The wave structure suggests we may be finishing 5 up .Which suggests correction
in this stock.
The dotted trendline gives a clue about shorting point,Presently tested trendline support
This script can be sold at rises,I don't expect a new high (above 945) in this stock for some time.

Check what brokerage houses say about this stock

Oracle financial services software

Regards
Rish


RESEARCH REPORTS

Saturday, April 11, 2009

>Reliance Industries Technical Analysis

Reliance the super heavy weight:)

It has surprised Bears as well as conservative bulls with its vertical rise day after day
for last few weeks.Reliance gas production was a big trigger for this humongous move.
Now the immediate question where this move can loose steam:).

Attached chart shows the probable move of it in coming weeks.

The assumption holds true if the starting point of wave 1 holds true(Green bold arrow).
So reliance should consolidate for some time in 1800-1600 range before it blasts up
to 2000-2100 region to make a considerable top for some time.

Very selective intraday shorting opportunities may arise in reliance in coming days
provided you know where to short.

and then there would be a nice long trade opportunity when consolidation gets over and
reliance targets higher levels of 2000-2100.

We can expect a nice fall from 2000-2100 levels.

Read what research houses think about reliance

Reliance Industries(MERRILL LYNCH)


Traders do comment about your counts or views on reliance.

Regards
Rish

RESEARCH REPORTS

Friday, March 27, 2009

>Technical Analysis Mahindra & Mahindra

Mahindra & Mahindra after breaking out from triangle gave nice upmove
The present wave structure suggest a profit booking.

Level wise if 405 is not breached on upside ,It can dip to 360-350 levels
to retest the triangle breakout levels.

Trade idea would be to sell it near 400 for downward targets of 370,360,350

See what brokerage houses are telling about mahindra & mahindra

Mahindra & Mahindra


RESEARCH REPORTS

Monday, March 09, 2009

>Technical analysis Bombay rayon(BRFL)

Bombay rayon (BRFL) Will try to explain the trading setup in this
sleek reward with negligible stop loss.

From chart its clear 5 down from top
the 5th ended up making a falling wedge which is a nice
bullish pattern which results in spiky rise with huge volumes
and exactly that happened.

See the combination of Elliott wave theory with chart patterns how nicely
both gelled together.
Result a solid vertical rise from 85 level to 100+ in a single day.
So after few failed trades or bad run who starts to think Technical s don't
work in Markets have a second thought before giving up.Technical s do work
perfectly at times and generally gives good hints about a particular trade etc
provided done with due diligence.
Do leave your comments whether you follow technical s or not.

RESEARCH REPORTS

Wednesday, March 04, 2009

>ICICI bank Technical analysis

ICICI Bank present chart structure suggest a rise towards 300 levels
before a big fall.

People long in ICICI Bank should keep stop loss to prevent themselves from losses
Chart structure suggests a possible 5 down if 280 is not held.
This view goes for a toss if ICIC trades above 330 and gives a close above that.
Shorts can have a big gain in it if shorted accordingly.

So track this script closely

Regards
Rish


RESEARCH REPORTS