Tuesday, December 31, 2013

Nifty fractal

Hi friends,
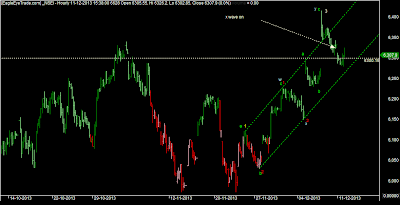
                   Another example that fractals appear on all time frames.
Todays intraday move resembles the daily move of nifty from 5100+
surprised

have a look yourself.See how similar are both moves these fractals keep appearing we only need
an eye to look for them ofcourse they tell a lot for the future move too it gives hints.

Regards
Rish

Monday, December 30, 2013

India bull realestate technical chart

Hi friends,
                   Revisiting IBR chart ,From october onwards the waves are quite clear.
We had a impulse followed by a abc correction and then a rising wedge or ending diagonal.
Of late this stock have been range bound in 80-50 .
In very short term as long as 66 is protected this stock has potential to hit back 80.
If 66 is breached the structure suggests distortion.
Overall after few weeks can try to project long term view for this stock
presently at a important juncture so i am keen to update this again and again.

Regards
Rish

Sunday, December 29, 2013

TCS technical chart

Hi friends,
                   Today would discuss TCS chart a IT heavy weight which is in secular bull
mode since 2009 .
I wanted to show how parallel channel works brilliantly at times,You can see how channel
top regularly successfully resisted 3 times ,This is most simple but usually most reliable
support and resistance tool.
 Technically looking at chart it brokeout from a small triangle now as long as it holds 200-1980
a new high to 2300 is possible even more can look at structure once it reaches there.

Regards
Rish

Friday, December 27, 2013

Yes bank technical chart

Hi friends,
                    Looking at yesbank hourly chart it shows a overlaped abcde
structure which suggests a final rise towards 385-390 before abcde finishes.
Traders who wants to trade this should keep stoploss at 369.
 Trade wisely.

Rish

Wednesday, December 25, 2013

Sriram transport technical chart

Hi friends,
                   Today i am going to discuss chart of Sriram transport .
A very clear wave chart we can easily count an impulse up from 2011 dec end.
Impulse finished by may 2013 .
We had a sharp reaction after 5 up impulse which retraced more than 80% of the
impulse,And smart recovery after that which is resolved into 1 up abc ,now a 3rd wave rise
only thing missing in this count for confirmation is volumes to confirm 3rdwave on,Lets
see in the coming days if volumes get into the stock.
According to this count this stock is in a strong uptrend and every dip is a buy as long as
550 holds.
This stock has potential to rise to new high soon ie 850+,Buy all dips in installments
to gain maximum,Lets see how stock performs.
Regards
Rish

Friday, December 20, 2013

nifty chart 20th dec

Hi friends,
                     Iam expecting the fall from yesterday to be forming a b wave
if 6125 holds i expect the following action given in chart .

Regards
Rish

Thursday, December 19, 2013

Reliance capital chart

Hi friends,
                   Revisiting old post on reliance capital,Iexpected max 410-420 and a fall in that
see the old post Reliance capital .
What happened we saw stock went on to make a top at 407+ and fell sharply after that presently
trading at 343+.
Technically as had told in old post abcde was anticipated and same happened it did the e leg
and fell back ,Now 333 range is a good support looking for a bounce back from these levels
Sit back and see the reaction of price to these levels to decide further move.
Regards
Rish

Nifty 19th december

Hi friends,
                   A bounce was expected from 6100  levels it bounced from 6125 levels its
understandable ,The levels to watch on upside would be 6237,6271and 6305.
So trendline support held so the squeeze continues,This squeeze has contracted the price considerably.
Regards
Rish..

Wednesday, December 18, 2013

Nifty 18th december

Hi friends,
                   Nifty is falling slowly for last 6 trading sessions.Strong support zone comes at 6100-6080
region ,If its held looking for a upmove else below this range fall can escalate,I m looking for a hold
of this range.
Regards
Rish

Friday, December 13, 2013

Nifty chart 13th december

Hi friends,
                       Eventually the gap got filled and nifty closed below that next support levels
come at 6200-6190 levels,From where a rise is expected towards 6300-6350 ,Lets see how nifty
reacts to this support zone.
So expecting supports of 6200-6190 to hold for now,Lets see what nifty does.

Regards
Rish..

Thursday, December 12, 2013

Nifty chart 12th december

Hi friends,
                  Nifty continued to fall in the same slow fashion,But managed to hold the
gap and attempted a good rally intraday ,Though it breached the 6300 level which
failed the white impulse see old post nifty 
 So since the gap is still held and the trendline is holding too need to see if nifty manages to hold gap today too.

Regards
Rish..

Wednesday, December 11, 2013

Silver technical chart

Hi friends,
                  Looking at short term chart of silver its interesting.
 We had a leading diagonal 1 complex 2 followed by simple correction in 4th to finish a
impulse .Then we has a complex time consuming abc .
The abc correction retraced almost 85% of total rise at 18.88$.
I expect a rally towards 21.55$ minimum ir the trend line resistance,After which a small
retracement can happen,Overall i think a rally towards 25$ has started with in between small hiccups.The following chart shows my Elliott count.
This count stands wrong if silver drops below 18.88 $.Lets see how silver moves in coming days.

Regards
Rish

Nifty chart 11th december

Hi friends,
                   Nifty hovered in that range only today if 6300 is breached white impulse would
fail,Rest remains same ,Characteristic of this rally has been sudden gaps ups after few days of
sleep.
So till 6300 is saved the extended impulsive move would still be an active alternative count.Overall
stocks are retracing from their resistances.

Regards
Rish

Tuesday, December 10, 2013

Nifty chart 10th december

Hi friends,
                   4 states election results have come ,now nifty can move its technical move any distortion
happened by news flow should subside in few days max.The following chart is self explanatory..
The impulsive 12,12 suggests big bull case for that we need to hold the gap which
was created yesterday.

Regards
Rish

Saturday, December 07, 2013

Sbi stock analysis

Hi friends,
                  Looking at the fall structure of Sbi from 2010 dec highs
Stock did a wxy till dec 2011,Then did a abc up for the full next year till dec 2012.
And has done a abc or 123 till 2013 September lows subject to 1970 holds(incase of 123)
Looking at a rally towards 1970-2000 minimum and then see further structure.Long traders should
look to book profit there.
The upward structure from september lows looks like a abcde up need to be watch full near 1970-2000,Till then all dips are buys in this stock.

Regards
Rish

Friday, December 06, 2013

Nifty chart 6th december

Hi friends,
                 The chart is self explanatory ,yellow suggests lower top,Its 5 down count
whereas red one is complex corrective up count which suggests a new high above yesterday.
Slowly the election fever is getting cured .
Regards
Rish

Thursday, December 05, 2013

Nifty long term analysis

Hi friends,
                   Rechecking the big picture of nifty,Nifty has been sideways uppish for almost 3 months
now sideways up down move with continuous falling volumes.Meanwhile the badly battered midcaps rising back,Not an easy market to understand continuous sector rotation.IT has been sideways ,Pharma falling along with FMCG, Banking is been volatile with in between fast up downs,Out of the
heavy weights LT has been on a roll it did 700-1080in matter of 3 months.Reliance has been sideways with in triangle ,ITC has been falling a slow fall along with HUL.
Looking at nifty i am of the opinion we are forming ascending broadening wedge ,With each
leg getting broader and broader towards upside.
The above chart shows my expectation ,If you see the whole broadening pattern has developed on falling volume.We test 6400-6500 and drop back to make a upper
bottom somewhere near 5500-5600 and rise towards 6800-7000.My reading says we can have a fake breakout and then reverse back in broadening channel to test lower trend line and reverse back to make a new high .
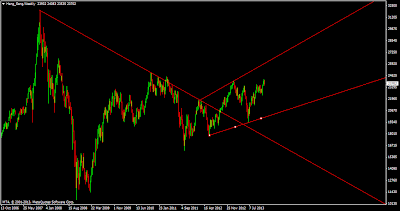
I Track Hangseng closely and its too making the same pattern lets see the chart of hand seng
Quite similar to nifty structure,Overall we should hit upper trendline resitance by january 2014
till then buy all dips for gains ,Be watch full January onwards.

Regards
Rish

Nifty 5th december

Hi friends,
                  As i mentioned in my yesterday intraday post nifty looked to have made abcde in the correction  from 6228  till yesterday low ie 6150 ,Which i posed before market close nifty 4th dec intra ,Lets look closely how i was able to get my count adjusted accordingly  when i saw yesterday
intraday move .
So market didgive a hint about whats coming today.I have adjusted my count and this rise could be 5th up or e up and we can go to 6300 ie1=5 in due course
Regards
Rish..

Wednesday, December 04, 2013

Nifty intraday 4th december

Hi friends,
                   As expected nifty started corrected ,But looking at the structure its looking its making a abcde from top don't go heavy with positions.Its evenly poised for tomorrow ,Supports are not broken yet .
Don't go home with naked shorts.


Nifty 4th december

Hi friends,
                      Nifty was sideways to down most of the day yesterday ,It didnot give a close above 6212 ,Now a retest of 6150 looks eminent below which the fall can stretch towards 6100 ,Where we
have to look for a pull back.
Chart remains same as yesterdays Nifty 3rd december

Tuesday, December 03, 2013

Nifty 3rd december

Hi friends.
                   As mentioned nifty went on to test 6212 zone and hovered there full day,Now if we dont
close above 6212 and continue rise i would reckon we will be making another abc as shown in the
chart below ,I am looking at chart and trying to project the further move,Not like most analysts or
fund managers who have become political analysts and giving their targets.Let us see how news
breaks pattern.One thing which looks certain is nifty move from last 2 weeks is like a musical chair
game few rises few falls so ultimately its maintaining respective crucial levels .

Regards
Rish

Monday, December 02, 2013

Reliance capital elliottwave analysis..

Hi friends,
                  Reliance capital is been in a range for many months,Its making abcde up with e leg on right now which can target 400-420 levels
Now this abcde can be finishing a C of previous ABC or this could be a leading diagonal ,
Leading diagonal would be a bullish case in which after finishing abcde a abc correction happens finishing which the stock can take off and breach 420 levels which would be a breakout of multi year
slanting trendline resistance,At present scenario look to book around 400-420 levels and reenter at lower levels,Would post again once we complete more wave structure.
Regards
Rish

Nifty 2nd november

Hi friends,
                  Nifty went past 6156 and remained above that full day ,Next target above that comes at 6212 ,Till that's maintained it looks to be corrective in nature,I would watch the move of next 2 days to ascertain the structure underway .
overall select midcaps continue to outperform irrespective of nifty movement as its range bound.
Stockwise HUL looks attractive out of large caps along with IT majors.

Regards
Rish

Thursday, November 28, 2013

Nifty 29th november

Hi friends,
                  Nifty continued its lackluster slow downward move for most of this week ,From
the look of the chart and the present few days of slow updown move suggests one more pattern
formation a triangle which is shown in below chart
With expiry being over nifty can slowly start its technical move

Regards
Rish

Wednesday, November 27, 2013

IRB Infra Elliottwave analysis

Hi friends,
                  Lets check the wave structure of Irb infra ,August 2010 Irb started to fall
the entire fall can be resolved into wxy ,The below chart shows the wave labeling clearly.
The firstfall resolved into a falling wedge followed by a simple abc .Right now its trading
near a very crucial juncture near 100.Above 100 this stock is heading towards big targets.
Above 100 this has potential to double in a years time max.
Keep this stock on your radar ,I would reevaluate it regularly to check what it does over a
period of time.

Regards
Rish

Tuesday, November 26, 2013

Nifty 26th november

Hi friends,
                    Nifty managed to stay above 6060 and went on to test 6100+ ,So i have started to think about a alternate count too which says we have finished c near fridays low.
Validity of this count holds if any fall which comes stays above 6060.
In case we breach 6060 the original count of b up remains valid,With december approaching and modi factor being hot topic among punters volatility gonna increase only.
Fot today any rise above 6120 would be considered positive and target of 6200 gets opened whereas if 6060 gets breached we head towards 600-5970
Regards
Rish

Monday, November 25, 2013

Nifty 25th november

Hi friends,
                   As said in previous post below 6100 support was 6060-50 which was too breached in the due course of the day final support comes in range of 5960-70  below which we directly target 5830-5800 upmove if any would be strong only above 6060 .

Sunday, November 24, 2013

How i streamlined my trading

Hi friends,
                    Weekend post ,I would like to share my experience i gained during my last 8 years as a Trader and adviser.
To start off i was like any newbie who used to buy and sell on anybodies advise ,And enjoy the adrenaline rush when the trade used to be in favorable direction on the other side get sad on every loss trade .This happened for quite some time ,It had to stop someday ,Well i had to stop as my trading account was down to almost zero!!.

That day onwards ,I started to look for traders or advisers who used to give trade calls and it used to fascinate me few of them regularly hit the right traders ,So i got one thing straight this can be done.
I zeroed in on Elliott wave as a tool to build my trade setups ,Had countless battles on stockviews arguments etc on yahoo and google groups each battle saw me coming out with a new experience ,Slowly i started to get a hang of how waves were unfolding in market
.
I tried mastering few trading setups and kept looking for their reemergence ,Slowly got confident and  started to make some money on my own trades .I lost money only when i deviated from my trade setup or some last minute changes in trading plan ,These mistakes i still do human mind after all but i always look to minimize these hiccups.
Would further discuss on this if  you fellow traders would like to know more let me know your experiences as well it helps in building a trading mindset to run along with live market which is full of cacophonies..

Regards
Rish    

Saturday, November 23, 2013

Jindal steel elliottwave analysis

Hi friends,
                    Looked at jindalsteel this could be forming a nice trade setup.Lets count waves from
180 levels It finished a abcde till 265 .
After that a time consuming b is evolving my expectation c of b is underway and the stock can fall towards 225-220 over some time after which it can rise towards 260,270.
Track this stock closely if the waves unfold the way i expect we have a nice trade on hands.
Regards
Rish

Friday, November 22, 2013

Nifty 22nd november

Hi friends,
                   We saw 6100 breaking and we tested 6065 with ease and further the wave gathered steam and we at one point of time tested sub 6000 levels ,We are nearing end of a wave after which  a relief rally ie b wave up should come some time from today lasting till monday or tuesday after which fall would continue..looking at 5960-5950 for bounce area..
Regards
Rish

Thursday, November 21, 2013

INDUSIND BANK Elliottwave analysis

Hi friends,
                   Let us look at indusind bank waves ,Its quite clear we saw 5 down from may top till end september and after that big abc is underway of which a is finished b is underway.

The b wave further again getting resolved into a abc of which ab is finished and c is underway the following chart is self explanatory looking for a fall till 360-350 ,Before things look upbeat for this stock.

Nifty 21st november

Hi friends ,
                     Nifty reacted to 61.8% retracement resistance and fell back it should test 6100 atleast and then make pattern for further move below 6100 potential
to test 6060 is high  would be following it closely as nifty is at a important juncture ,Which opens up nifty for 300 points move either side would track it closely.


Wednesday, November 20, 2013

Nifty midcap index midcaps buzzing

Hi friends,
                   off late we have seen select midcap stocks have started to buzz and irrespective of market movement they have been running ,Looking at the midcap index chart ,It shows a contracting move of  triangle in process ,Each wave has 3 waves so a classic triangle or a flat possibility arises.
Presently d wave of triangle is unfolding with first leg ie a leg of d almost getting over and b can start after which a rally towards 8500 should happen.Gist would be to buy select midcaps in dips for handsome gain for next month second half .

Regards
Rish

Nifty 20th november

Hi friends
                  Nifty reached to the 61.8%  of the fall retrace yesterday and was struggling to cross that looking for a reaction at this juncture and see if it looses steam or goes sideways ,Today would decide further move of nifty for next few days .
The bullish part its trading above the trendline .

Regards
Rish

Tuesday, November 19, 2013

>BPCL long term wave counts

Hi friends,
                  Let us see how elliottwave helps in constructing a trade set up and how on each time frame we can apply it.
Bpcl on long term charts look to be in C of big ABC
Now looking at the structure of C it looks to be making a ending diagonal with e leg running
ie last abc is on a is over b running after which c rally can start towards 450
look for a nice long trade in this script around 300-310 for a handsome gain of 20-30%.

>Bharti Airtel Elliottwave Analysis

Hi friends,
                  Bharti has been move in contracting channel for years together ,According to the present structure it can stretch max till 380-400 ie the d leg of C ,I would be looking to book longs and see for shorting opportunity near resistance ,The e leg can take this stock all the way to 250 levels ,From where a multi year bull market can start in Bharti airtel.
If the resistances are breached the expected fall may not materialize ,Keep the stock on your radar..

Regards
Rish

Friday, November 08, 2013

>Indiabull realestate technical analysis

Hi friends,
                     India bull realestate is forming a nice pattern lets see how it performs after this
I saw a falling wedge breakout in it and its retesting the breakout line again (58-56) then it can rise
towards 72-75 .

Risk is less in this trade idea as supports are nearing.


Friday, October 25, 2013

>Reliance Industries Technical Analysis (Elliottwave analysis)

Hi friends,
                   Reliance industries has been trading in a range for last several months ,This contraction should give way to a smooth one way move ,Above 930 stock can give 100 points move in a short span of time ,Otherwise the contraction continues .
Keep track on this super heavy weight this should show nifty move for coming months.
Regards
Rish

Thursday, October 24, 2013

>Nifty elliottwave analysis

Hi friends,
                   Writing after a long gap. Hows market treating you ,Must be good i assume with all time high at a striking distance.
Well in my study i had anticipated a rally from 5100 max till 5950+-50 ,Which nifty overshot handsomely.
At present so many ifs and buts in the picture many counts look active ,So i thought let me share few scenarios which i think we have at present and let market

decide ultimately which way it moves:).


The above 2 charts show mega bull and mega bear case .Mega bull case its 3rd wave on from 5100
but looking at the different sectors it looks differently all are not in sync aloso no volumes to support 3rd wave case  which gives hint it may not be 3rd wave afterall.
Mega bear case considers it a broadening ending with E wave on after which we breakdown .

One thing which am getting confident is we cant have a rally without a consolidation

Lets try to analyse the rally from 5100

Lets see over the next one week how nifty shapes up which would give us further clues about whats in store for us.

Tuesday, August 20, 2013

>Nifty elliottwave analysis (bigger picture)

Hi friends,
                  Nifty did perfect move as was predicted 5750 nifty  and phuss ,Now with nifty joining broad based market move ,There was a need to see bigger picture
The chart shows clear waves ,Its self explanatory monthly chart which suggests move all the way to 4500.
The green trendline which comes near 5250-5200 wont be broken soon there  should be a nice relief rally from there i think. So till 5500 is not broken upward just trail shorts. 5300 onwards need to be careful in shorting ,Would post lower time frame charts soon as the move matures..

Happy trading

Monday, August 12, 2013

>Nifty elliottwave chart

Hi friends,
                   Nifty  pretty much moved the way i expected it for sometime now ,Until recently when i expected 5600 to hold ,But nifty breached 5600 and went all the way to 5500.
Overall not much has changed with the 5600 breach its almost certain we not going much higher now
we are below trend line supports at most we can go and retest them ie 5750 max ,I expect this sideways uppish move to happen for sometime before the next leg of down move starts .
Have labeled the nifty move .

Happy trading..

>IDBI elliottwave analysis

Hi friends,
                   Just thought of sharing IDBI analysis look at the beauty of patterns which happen on all time frames be in intraday or daily even monthly.
From the chart its seen we had finished a 5 wave up move by the year 2006 and from 2006 to 2013 we are making a expanded triangle which is in its last leg down ie e down .All those investment lovers should get ready to closely watch this script .
Keep looking for more such picks .

happy trading..

Monday, August 05, 2013

LIVE NEWS


Friday, August 02, 2013

>Nifty elliott wave analysis

Hi friends,
                   Nifty has broken 5800 and tested an important support zone 5680-5620 ,I expect nifty to hover here and attempt a rally towards 5850 or 5950 and then again resume downward journey.Be watchfull if shorting here shorts now only below 5600 or on upside.
Stocks have been falling like there is no tomorrow be very selective with stocks buy stocks only when nifty reverses don't try to be a early bird it can be injurious to ones financial health .There is nothing called cheap stock in bear market and nothing called expensive stock in bull market ,Trade wisely.

Happy trading

Wednesday, July 31, 2013

>MCDOWELL Elliott wave analysis

Hi friends,
                      Tonight trying to put waves for one of the great out performer of this market ,Yes am talking about MCDOWELL the mad bull 600 to 2800 in matter of 1 year.
 The first chart shows its long term waves which shows its in 5th up .The second chart shows the internal structure of 5th wave which looks to me is in terminal stage last rise kind it should kiss 3000 i think before topping .
Investors who had their share of highs should look to book profit slowly u see hangovers are quite bad after a long night of drinking.

Happy trading