Wednesday, January 22, 2014

Nifty Technical chart Presentation

Hi friends,
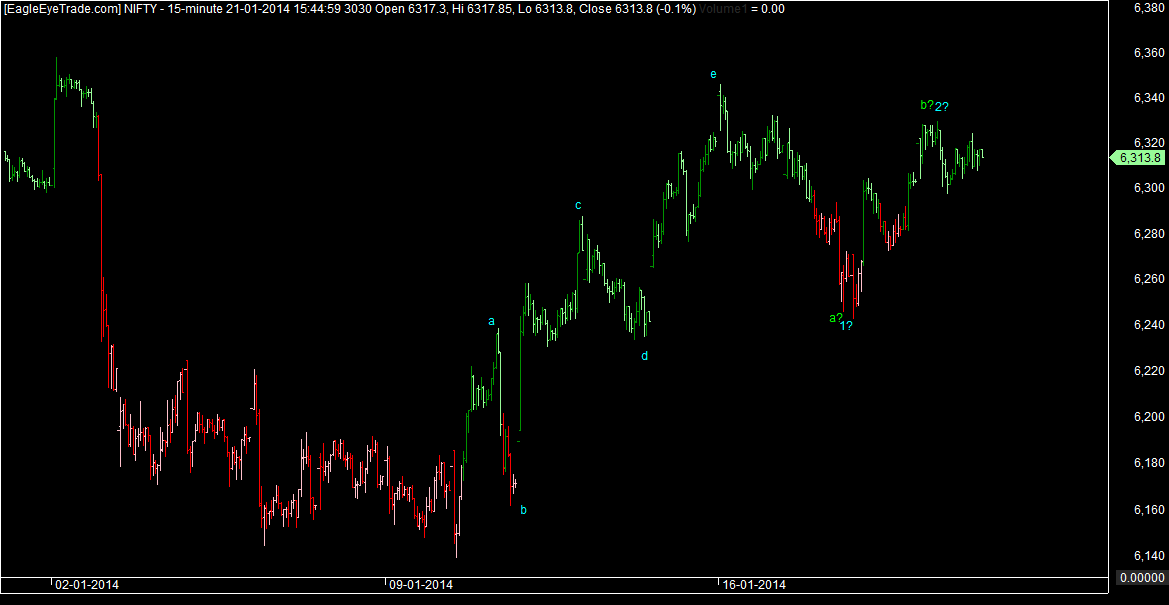
                   Nifty continues to hover in the same range not much happened from previous post
we had a small drop and now almost retesting that top.
The above chart pretty much says what i told you its hugging the upper resistance trendline
coming to a lower time frame we see following wave structure which suggests this
sideways movement can end any time now.
Broadly if the previous high ie e is not taken out any of the count can fit in blue one
would be nasty wheras green one would be a small correction max 6130 kind but if blue one
happens we are in for a deeper correction.This would get invalidate if we cross 6350.

Regards
Rish

Monday, January 20, 2014

Banknifty Technical chart

Hi friends,
                   Looking at Banknifty chart ,I rarely trade on banknifty its supposed to be
quite volatile,I try options at times when i get confident.
Anyhow coming to the chart ,I see following on chart.

We can see from chart that we have finished abcde on 9th dec 2013 and are in correction
after that a slow correction,Now this index would show strength above 11200 below that it would continue its slow downward correction we Have retraced total rise of abcde 38.2% .
Looking at stocks within Banknifty PSU banks and Private banks have diffrent structures.
Banknifty is on watch for next few days to see if it shows strength and goes above 11200 or not.

Regards
Rish

Saturday, January 18, 2014

Coalindia Technical Analysis

Hi friends,
                   Today i have coal india chart ,I would analyze this stock according to wave analysis.
Have a look at the following chart which is of daily time frame.
From july end 2011 high this stock started complex correction ,Red labeling wxy.
We have seen complex correction takes time this stock from a high of 400+ went all
the way to 240 in 2 years time frame where a big WXY ended.
Lets look at the structure closely from 240 onwards look at the following chart.
 We have already seen abc twice which suggests a triangle underway or a flat correction.
We have to see the structure of this currect move from 307+ to figure out whether a triangle
is on,If its a triangle the fall should not exceed below 260 and should reverse up.Keep this stock on
radar nice trending move would be underway once triangle or flat correction gets over.
One more important reason to track this stock this stock mostly remains unaffected by nifty move.

Regards
Rish

Friday, January 17, 2014

Nifty technical chart 17th january

Hi friends,
                   Nifty is very much in triangular move,In last post i had mentioned about d up
we can see nifty has almost reached there.Refer to last post Nifty technical chart .

Now in current scenario till nifty doesn't cross 5360 ,It would be assumed its in d up
Why i had to think about this because sensex did break 2 nd jan high ,Though it
came back a bit after crossing it.
  Today or max by friday we should know whether e leg fall of triangle happens or
nifty tries diffrent things :).

Regards
Rish