Tuesday, December 10, 2013

Nifty chart 10th december

Hi friends,
                   4 states election results have come ,now nifty can move its technical move any distortion
happened by news flow should subside in few days max.The following chart is self explanatory..
The impulsive 12,12 suggests big bull case for that we need to hold the gap which
was created yesterday.

Regards
Rish

Saturday, December 07, 2013

Sbi stock analysis

Hi friends,
                  Looking at the fall structure of Sbi from 2010 dec highs
Stock did a wxy till dec 2011,Then did a abc up for the full next year till dec 2012.
And has done a abc or 123 till 2013 September lows subject to 1970 holds(incase of 123)
Looking at a rally towards 1970-2000 minimum and then see further structure.Long traders should
look to book profit there.
The upward structure from september lows looks like a abcde up need to be watch full near 1970-2000,Till then all dips are buys in this stock.

Regards
Rish

Friday, December 06, 2013

Nifty chart 6th december

Hi friends,
                 The chart is self explanatory ,yellow suggests lower top,Its 5 down count
whereas red one is complex corrective up count which suggests a new high above yesterday.
Slowly the election fever is getting cured .
Regards
Rish

Thursday, December 05, 2013

Nifty long term analysis

Hi friends,
                   Rechecking the big picture of nifty,Nifty has been sideways uppish for almost 3 months
now sideways up down move with continuous falling volumes.Meanwhile the badly battered midcaps rising back,Not an easy market to understand continuous sector rotation.IT has been sideways ,Pharma falling along with FMCG, Banking is been volatile with in between fast up downs,Out of the
heavy weights LT has been on a roll it did 700-1080in matter of 3 months.Reliance has been sideways with in triangle ,ITC has been falling a slow fall along with HUL.
Looking at nifty i am of the opinion we are forming ascending broadening wedge ,With each
leg getting broader and broader towards upside.
The above chart shows my expectation ,If you see the whole broadening pattern has developed on falling volume.We test 6400-6500 and drop back to make a upper
bottom somewhere near 5500-5600 and rise towards 6800-7000.My reading says we can have a fake breakout and then reverse back in broadening channel to test lower trend line and reverse back to make a new high .
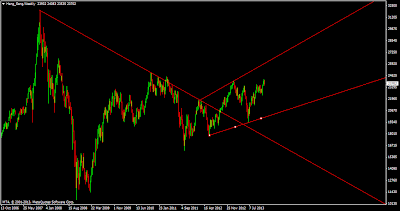
I Track Hangseng closely and its too making the same pattern lets see the chart of hand seng
Quite similar to nifty structure,Overall we should hit upper trendline resitance by january 2014
till then buy all dips for gains ,Be watch full January onwards.

Regards
Rish