HDFC BANK trading at crucial point

lets look at the chart.
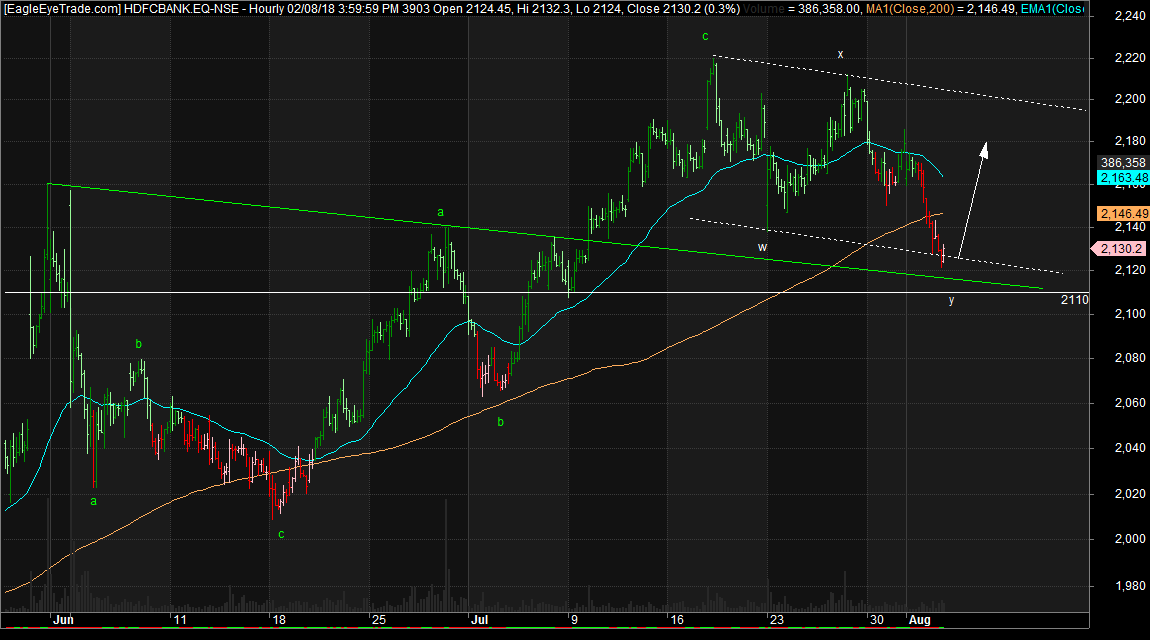
This is hourly chart we have finished a wxy correction or about to finish. 2110 is very good support
if this is held expect good bounce .
private banks offlate are bit into profit booking lets see how this trades tomorrow.


