What a stock ever since inception impulsive move.
lets look a closer view to get a better view.
daily chart.
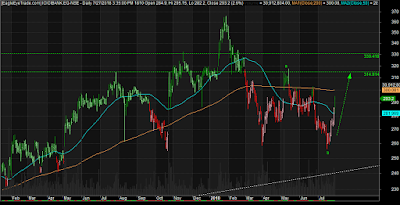
A good correction in parallel channel wxy correction is done .Point to ponder now
is correction over or not.The stock is still trading below trendline resistance.
This could be a X wave too,Above 340 the correction looks over and stock can continue upward
journey.Lets see how the stock reacts in coming days.
I have tried to count waves.This looks the best possible wave structure
for this stock as of now.
lets look a closer view to get a better view.
daily chart.
A good correction in parallel channel wxy correction is done .Point to ponder now
is correction over or not.The stock is still trading below trendline resistance.
This could be a X wave too,Above 340 the correction looks over and stock can continue upward
journey.Lets see how the stock reacts in coming days.


