Wednesday, June 28, 2017

>Oracle fin (OFSS)

Hi friends,
                     IT has been in correction and still no uptrending patterns have emerged in it ,OFSS is one such chart which has goot a clear wxy pattern coming up let me put the chart.
The stock looks to be in c of y which can take stock towards 3400.Lets see how stock move in coming days.

Tuesday, June 27, 2017

>Gail

Hi friends,
                    The structure of gail looks good for a bounce Lets see the chart.

A wxy has finished so as long as 348 holds this has potential to retest 388 lets see if the expected x wave or a new wave bounce materialises .

Friday, June 16, 2017

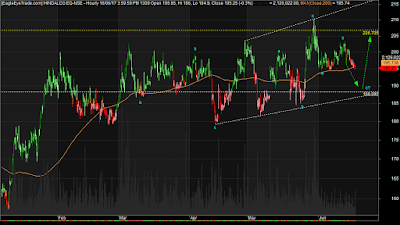
>Hindalco

Hi friends,
                   Hindalco has been trading in a range for sometime now the waves are overlapping
lets see the chart.

Expecting stock to drop towards 190-88 levels and rise towards 205+ Lets see how stock moves next week.


Wednesday, June 14, 2017

>NTPC

Hi friends,
                   Looked at NTPC chart,Can see a nice leading diagonal.The move started from below 110 and went all the way to 175+ lets see the chart structure.
Right now the stock is correcting this rally it has corrected 178 to till 155 and is trading in a squeeze.
Keep a track on this stock would update on this,As the pattern gets ripe.

Sunday, June 11, 2017

>Nifty elliottwave

Hi friends,
                   Nifty has been showing small correctives followed by comparative large upticks,We saw them in the last post i wrote.Nifty elliottwave ,Here again i am able to count a wxy in small timeframe let me put the chart.
The above chart is well labeled.Assumption is as long as 9690 is not broken this rise is x wave and nifty can fall back to 9600 to make z wave ,Lets see how nifty moves 9580-70 is support.

Thursday, June 08, 2017

>Banknifty

Hi friends,
                   Banknifty has been doing quite squeezed move for a week now ,Its nearing lower trendline support.
The trendline support comes at 23450-60 if banknifty continues to hold this range should continue uptrending ,If this range breaks expect fast fall towards 23000.

Sunday, June 04, 2017

>Ibullhousing elliottwave

Hi friends,
                   Looking at Housing finance charts this weekend,Zeroed on Ibullhousing .Lets look at the chart.

The chart is well labled ,The stock is in c wave up which would ideally do 1225-35.This range 1225-35 is resistance zone for this upmove lets see how stock reacts to this range.