Thursday, February 23, 2017

>MRF wave structure

Hi friends,
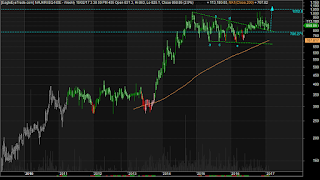
                    MRF had a super run ,It made a triangle and broke it up ,Sure many would have bought that breakout ,Ever since the stock kept dragging down (slow drop ) .
The above chart shows the triangle and the retrace after breakout which has retraced .Lets see the fall closely. On a hourly chart .

The hourly structure shows a triple zigzag unfolding wxyxz right now in z .Stock looks to do good in march expiry should be bought in dips ,This can target 56000 easily.

Tuesday, February 21, 2017

>APOLLO HOSPITAL wave structure

Hi friends,
                  Checked a interesting chart APOLLO HOSPITAL.The chart has got clear waves.
let me put the chart.

The chart shows us how the stock topped by making a wedge or ending diagonal in elliott wave terms
From there the stock started to drop and the stock fell in pattern and made a wxy correction which is labled in chart,Look at the parallel channel the stock is maintaining in the correction,1330 is steep resistance now for the stock,

Monday, February 20, 2017

>Nifty wave structure

Hi friends
                 Looking at nifty which is still shy of  high made in sept 2016 unlike banknifty which has taken that high convincingly.
Lets look at the daily chart of nifty .
From the chart we can see an important resistance is approaching ie 8925-30 .Bank nifty has taken this resistance already nifty os lagging banknifty this time all because of super heavy weight HDFCBANK rally.Lets look at the rally from sub 7900 levels closely .Let me post hourly chart.
The move is fast with small interrupts inbetween ,From this 8700 is a strong support for now and till thats maintained stock specfic action looks to continue on the upside resistance to look for would be 8925-30.

Sunday, February 19, 2017

>Reliance elliottwave analysis

Hi friends,
                  Reliance has been sideways for almost 8 years without showing considerable move.
Its been trading in a triangle ,Which can be seen in following chart.


The range is getting squeezed as seen from the chart ,abcd is done and a small triangle is again in process,A closer look at the chart shows the internal waves as shown in the following chart.


From this chart we can see 1150 is the breakout level for this triangle ,Internal waves of triangle suggests wave e is pending we have to see wave e goes deep down or remains sideways overall above 1150 this stock can go in new territory.Keep a watch on this stock would update when wave structure gets ripe.


Saturday, February 18, 2017

>Granules elliottwave

Hi friends,
                  weekend post is granules ,The pharma as a whole is not the flavor right now,Who knows the sector can surprise soon.
I am posting weekly chart of granules the waves are so clear,The impulse started after 2008 carnage is still on with 5th wave pending.
The stock witnessed multi year 3rd wave and right now consolidating in a probable 4th wave triangle 
after which the pending 5th wave can take stock towards 200+ levels.A trader should make a position above 148 which points that the triangle has been overpowered and a smooth move towards target could come.As a investor the stock should be bought in dips .


Thursday, February 16, 2017

>Petronet TRIANGLES

Hi friends,
                   Petronet has been trading in triangles for some time now.
First it was in a bigger triangle from last october till late jan 2017 ,It did break that triangle but again started to consolidate in a smaller triangle .
look for a fast move soon as its been consolidating for long time,367 is support for the stock and above 393 can move towards 420 and further towards 450.

Monday, February 13, 2017

>Banknifty

Hi friends,
                   In my last post on banknifty ,I had mentioned about resistance which should get overpowered eventually.

We can see from the chart the price is trading above the trendline resistance,Its been trading above it for a week now,A correction is expected only below 19900 in which case it can damage chart,So any fall below 19900 not good for banking stocks,Above it it would be taken as consolidation after a steep rise.

Friday, February 10, 2017

>INFO EDGE (NAUKRI)

Hi friends,
                  Infoedge was trading in a triangle for more than 2 years.


The squeeze is getting time consuming big move should come soon according to chart ,
As long as 786 holds a move towards 1000+ is open .

Tuesday, February 07, 2017

>HCLTECH Trade setup

Hi friends,
                  The following is hcltech hourly chart.
i am sharing a small portion of chart which shows a promising pattern this is to show how to come to a trade setup using elliottwave analysis.
From the chart we can count clear abcde up which is followed by a good time consuming abc till 780.From 780 we had a sharp rally till 835 levels and after that the stock is consolidating .
Trade setup here would be to buy this stock in dips till 780 is saved target would be around 870-880 levels,Track this stock in coming days to see how this moves .

Monday, February 06, 2017

>LUPIN update

Hi friends,
                   Today lupin intraday had a big rise of 5% and made a intraday high of 1573.6.
As i discussed in the old post LUPIN ELLIOTTWAVE ANALYSIS the stock didnot go above 
1580-86 so i would still stick with the view i had posted earlier.Lets see how it performs this week.

Sunday, February 05, 2017

>PNB Gilts target

Hi friends,
                   Timing in stock picking matters alot ,pnbgilts kept oscilating in a triangle for 8 years.
Must would have frustrated someone who entered in 2008.
This perfect example which shows pattern in bigger timeframe ie monthly.
Look at the clear 5 waves in a triangle abcde .
The stock broke out after 8 years of consolidation and is set to reach triple digit in coming time catch this stock in dips if you get one :).
This breakout is backed by huge volumes which gives more confidence about the follow though .

Track this stock and try catching if you get a good dip in this.

Thursday, February 02, 2017

>Banknifty elliottwave

Hi Friends,
                     Today banknifty tried to break the trendline resistance,The below chart shows the trendline.
Lets see how it behaves in coming days 
as the resistance is hit.Ideally this resistance should be taken out in coming days ,Lets see how the price behaves which would give further clues about future movement.

Wednesday, February 01, 2017

>MARUTI elliott wave counts

Hi Friends,
                   Maruti the relentless BULL,This is moving one wave since 2012.
A 2 year consolidation correction (2010-2012),Since then its one way no correction more than 6 months.The stock has gone almost 6 times in over 5 years.
The above chart is weekly chart the waves look so clear in it. We have a clear impulsive move lets break it down,We had a leading diagonal in wave 1 and then a multiyear 3rd wave .
Presently 5th wave is on which is last wave up before abc correction unfolds.
Posting another chart Maruti daily to have a closer look at 5th wave.

From the above chart look at the trendline drawn to look for the end of the trend .Once this trendline breaches the move is over for quite some time.Many investors who have bought for long term in this range should be careful at these levels if the trendline breaks down .Keep eye on this trendline would touch on this again in coming weeks.